
4H Chart
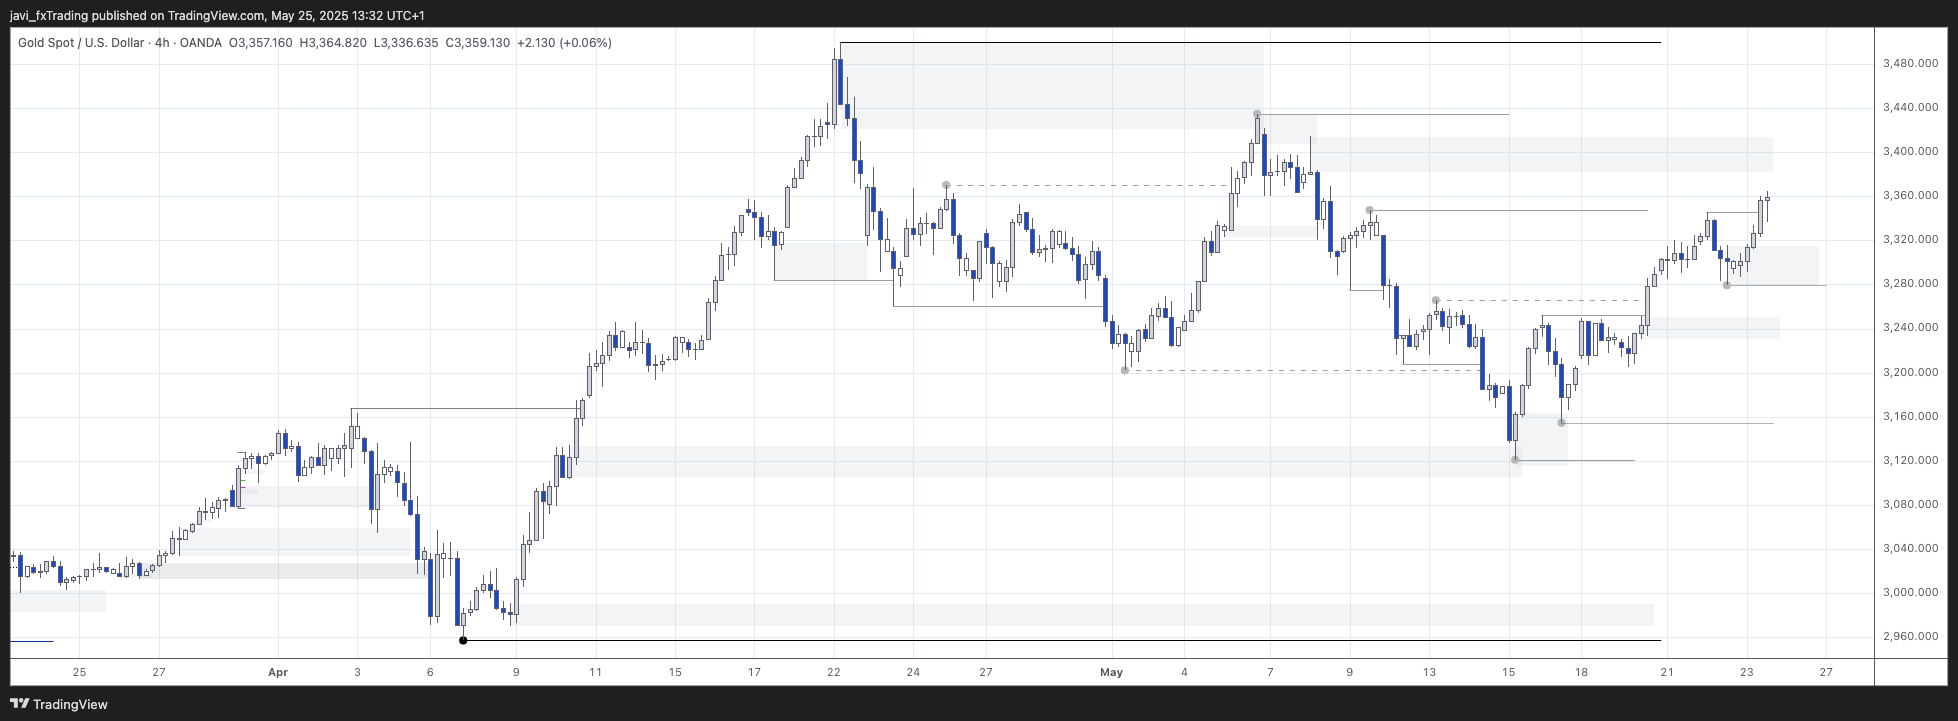
4H swing is bullish. 4H internal is bullish.
Price did not retrace to the PoI around 3,240 before starting to push up again. Likely to continue up until the next highlighted PoI where a pullback is expected. It could be minor though considering that we are in the continuation leg of the 4H swing aiming at the weak 4H high on the top of the chart (all time high).
15m Chart
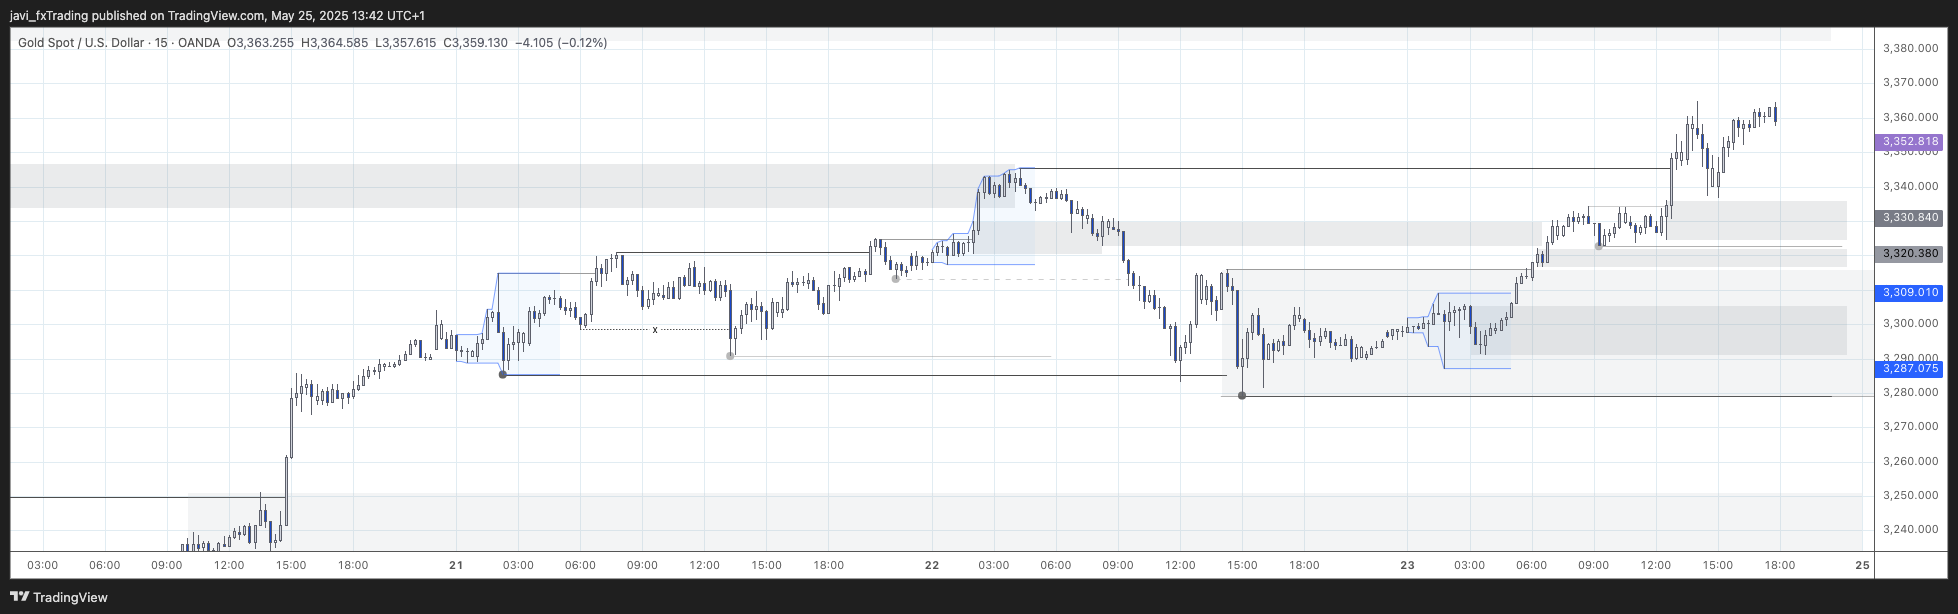
15min swing is bullish. 15min internal bearish.
Price reached the 15min strong swing low but never broke it (body break). As seen in the 4H chart, price did not reach the 4H demand area below either before starting to push up again.
I started to map internal structure again from the bottom (where the wicks try to break the strong internal low). The reason being the lack of structure in the leg down. The 15min swing weak high will be broken by the end of the session heading towards the next 4H supply area that can be seen (barely) at the top of the chart.
Session Outlook and Entries
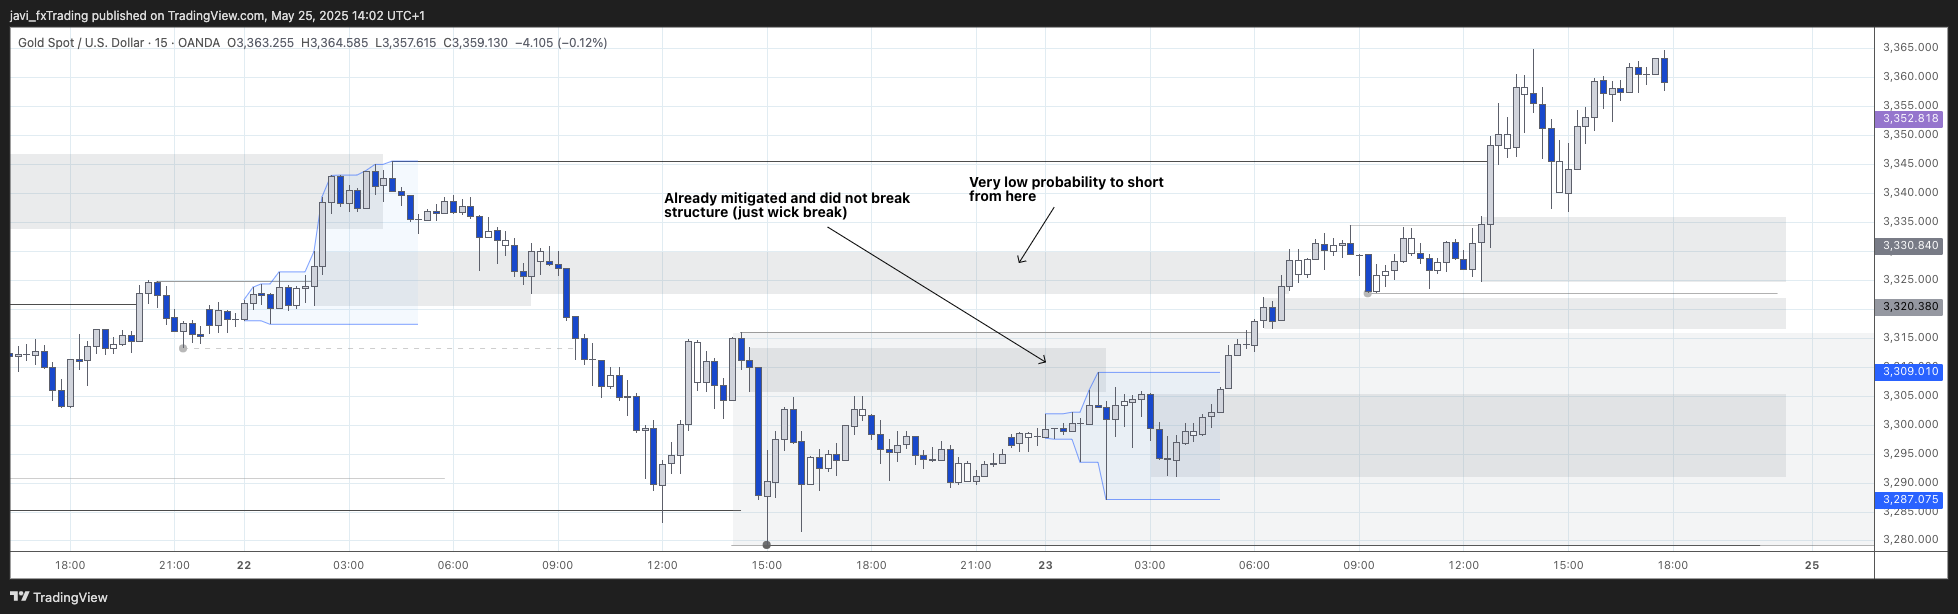
Bias for the session is bullish as internal structure turned bullish before session opened.
Price started to move up without leaving any interesting area to trade from. On the first bearish candle on the way up, I draw a PoI but price missed it by less than a point. It was not a great one anyway as price did not really “swing”, it just printed a bearish candle. After some consolidation, price pushed up again leaving this time a good PoI to trade from but price missed it again. No entries for me during this session.
Final Thoughts
- Keep Calm and Carry On.
- Not all the instruments that I trade are going to give me an entry every day, so no issues here. Move on and check for better opportunities in other instruments.