
4H Chart
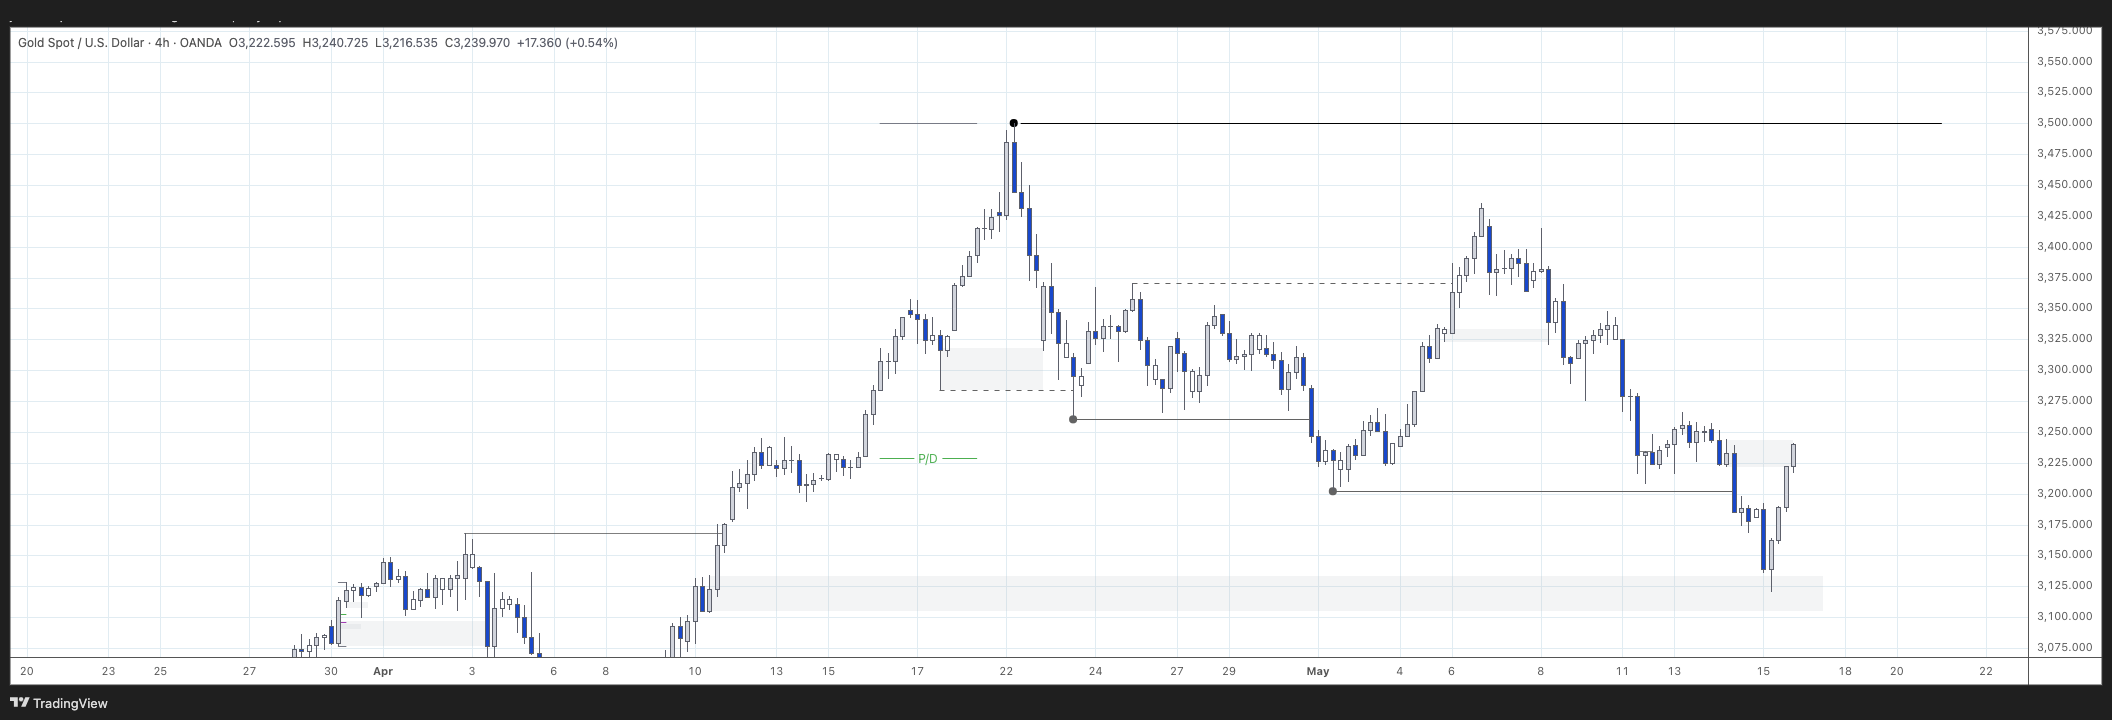
4H swing is bullish.
We are starting to see internal bearish structure after reaching all time highs. Price has already retraced to the discount area of the last bullish leg (see green line P/D). Currently a bit choppy as the internal structure changed to bullish and went back to bearish.
There are a couple of possible points of interest (POI) both in the discount area, closest one around 3,120 and the other one at the extreme just below 3,000 (not reflected in the chart).
15m Chart
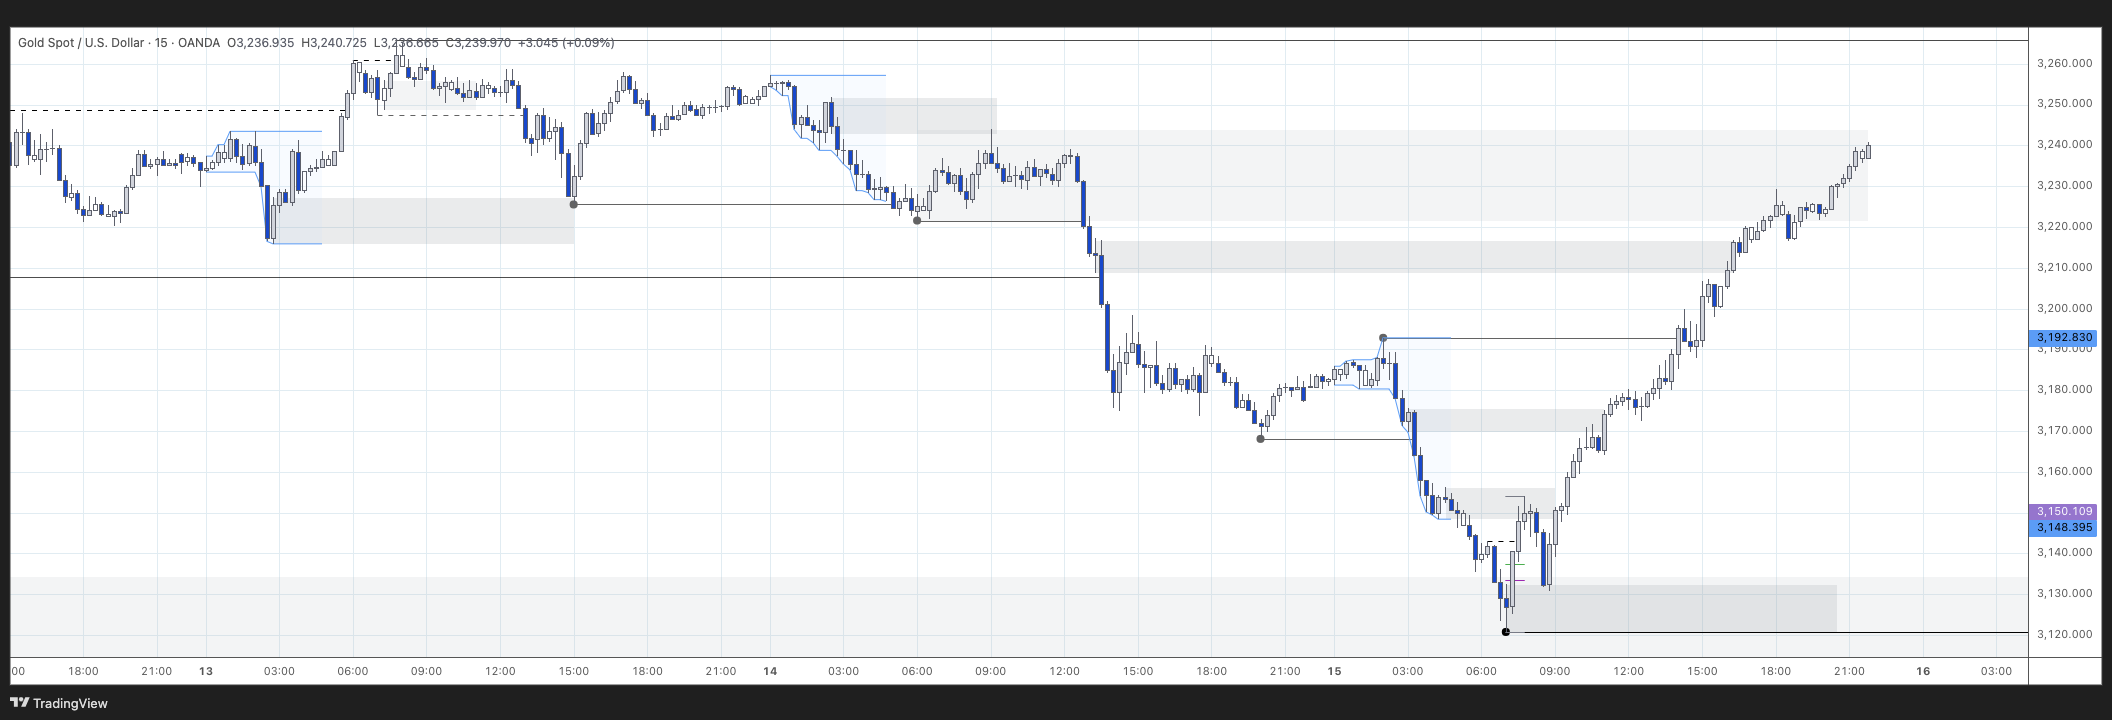
15m swing is bearish, aligned with the 4H internal structure. The strong high at the top just above 3,260 and the weak low formed at the beginning of the session. 15m internal structure is also bearish with the last break during Asia session (light blue area marks the Asia session in my charts).
There are a couple of POIs in the last internal bearish leg (supply areas) but I would not consider shorting against the 4H demand area just below.
Session Outlook and Entries
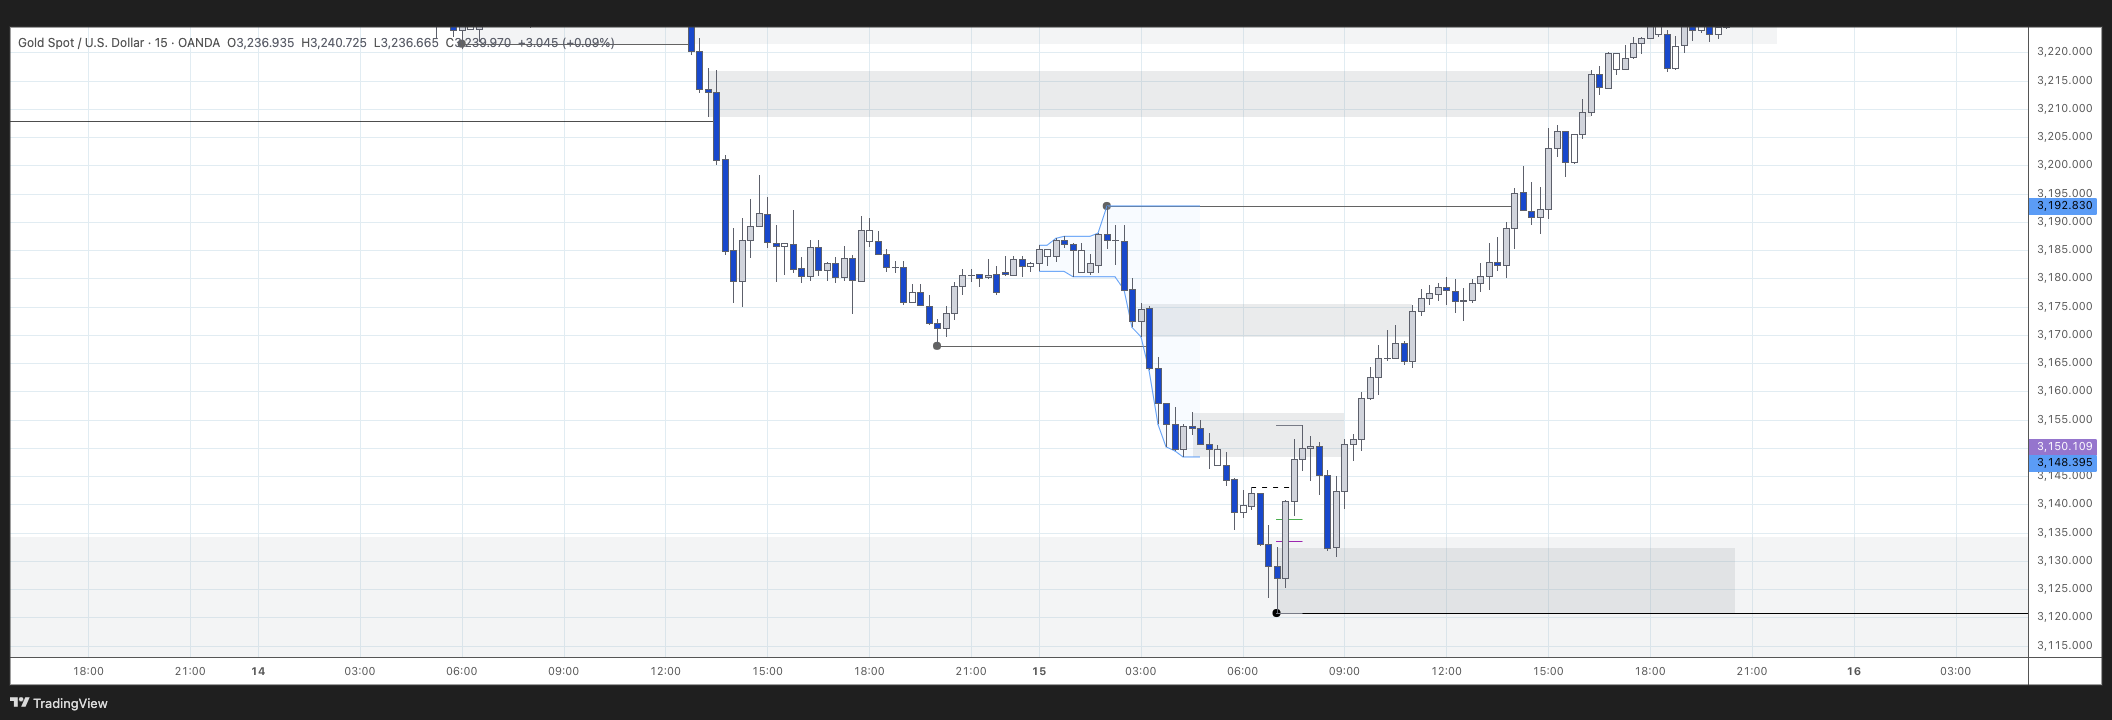
My bias for the session was bullish as I was expecting some reaction after reaching the 4H demand which was too close already to try to short to that level. This could easily change depending on the reaction to that level in case of the bearish trend continuing.
At the time of Frankfurt open, 7am London time, price reached the 4H demand area. With both 4H internal and 15min heavily bearish, I did not want to enter long just on the touch of the area (the SL would have been quite wide trying to cover that entire 4h area) as I wanted some bullish structure to develop. There was a 15min demand area quite far to the left but considering the overall bearish structure I preferred to rely on stronger 4H area so I did not reflect it in the charts.
Reaction was strong with a very bullish bar, just what I wanted to see. After the CHoCH (Change of Character), the dotted line, I was ready to enter long. I went for a multiple entry with limit orders around the 50% and 61.8% Fibonacci levels and SL just below the low. Another option would have been to enter in the edge of the 15min demand area created.
The reaction to the supply area above was stronger than I wanted to see. Both limit orders were filled nicely and fortunately price just flew from that level. My TP was just below supply area at 3,170. I could not hold it all the way there so I ended up exiting just over 3,162 for an average of 1.7 R:R.
Final Thoughts
- Waiting for some OF (Order Flow) change gave me more confidence considering the bearish outlook.
- Still experimenting with the entry model. Gold is a very bullish instrument and tends to not retrace back to the POI that initiated the move. I am favouring for now a 50% retracement in tight ranges but it will depend on R:R based on structural targets.
- I need to improve on holding the trades. After going through the first possible resistance area I should have kept the position at least until the next one at 3,170.