The market can exist in one of two primary states: trending or ranging. When trending, it can either be in a bullish (uptrend) or bearish (downtrend) phase.
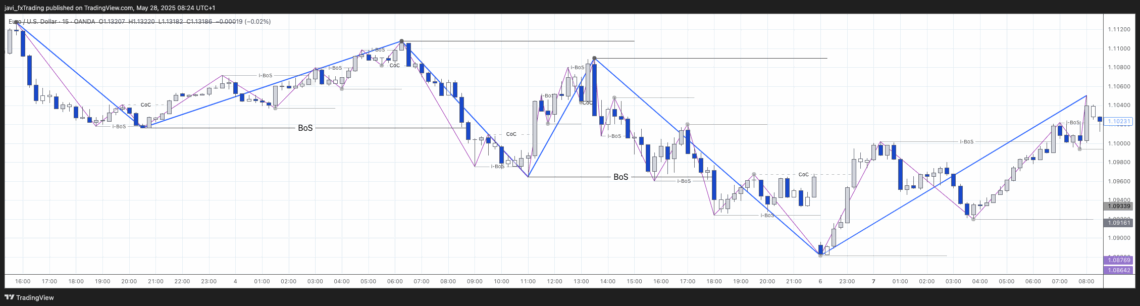
- Bullish market: price is making higher highs and higher lows.
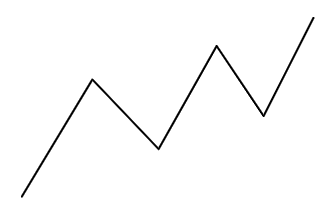
- Bearish market: price is making lower highs and lower lows.
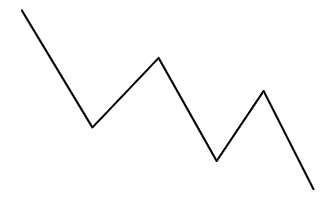
- Ranging market: price is mostly contained between two levels, changing from bullish to bearish without clear direction
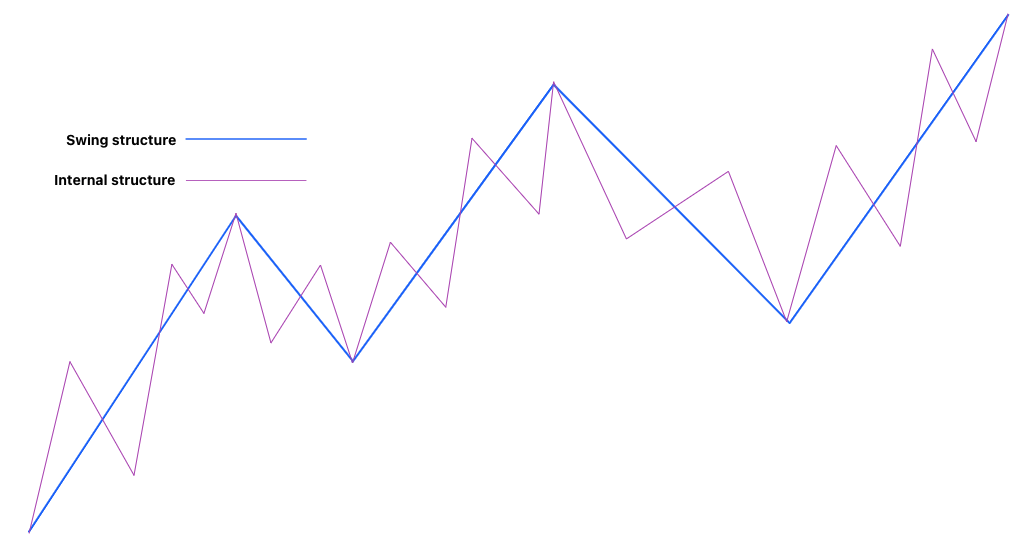
Swing vs Internal Market Structure
Before defining what are these two types of structure, let’s clarify some terminology:
- A swing high is a local maximum — a high point surrounded by lower highs on both sides.
- A swing low is a local minimum — a low point surrounded by higher lows on both sides.
Basically, swing highs and lows are turning points where price action leaves a peak or a valley.
- Swing market structure: the sequence of swing highs and swing lows that define the current trend.
- Internal market structure: smaller swings or price movements that occur within the larger swing market structure.
There’s no strict rule for distinguishing swing structure from internal structure. It can be discretionary, based on experience trading a specific instrument, or defined by a rule — for example, considering a move of 50 pips from a recent high or low in the opposite direction as a valid swing.
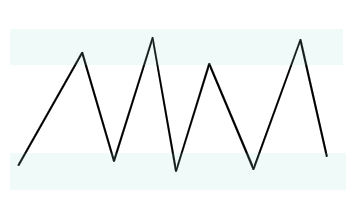
In the EURUSD chart below, we can see a clear bullish structure, characterized by a series of higher highs and higher lows.
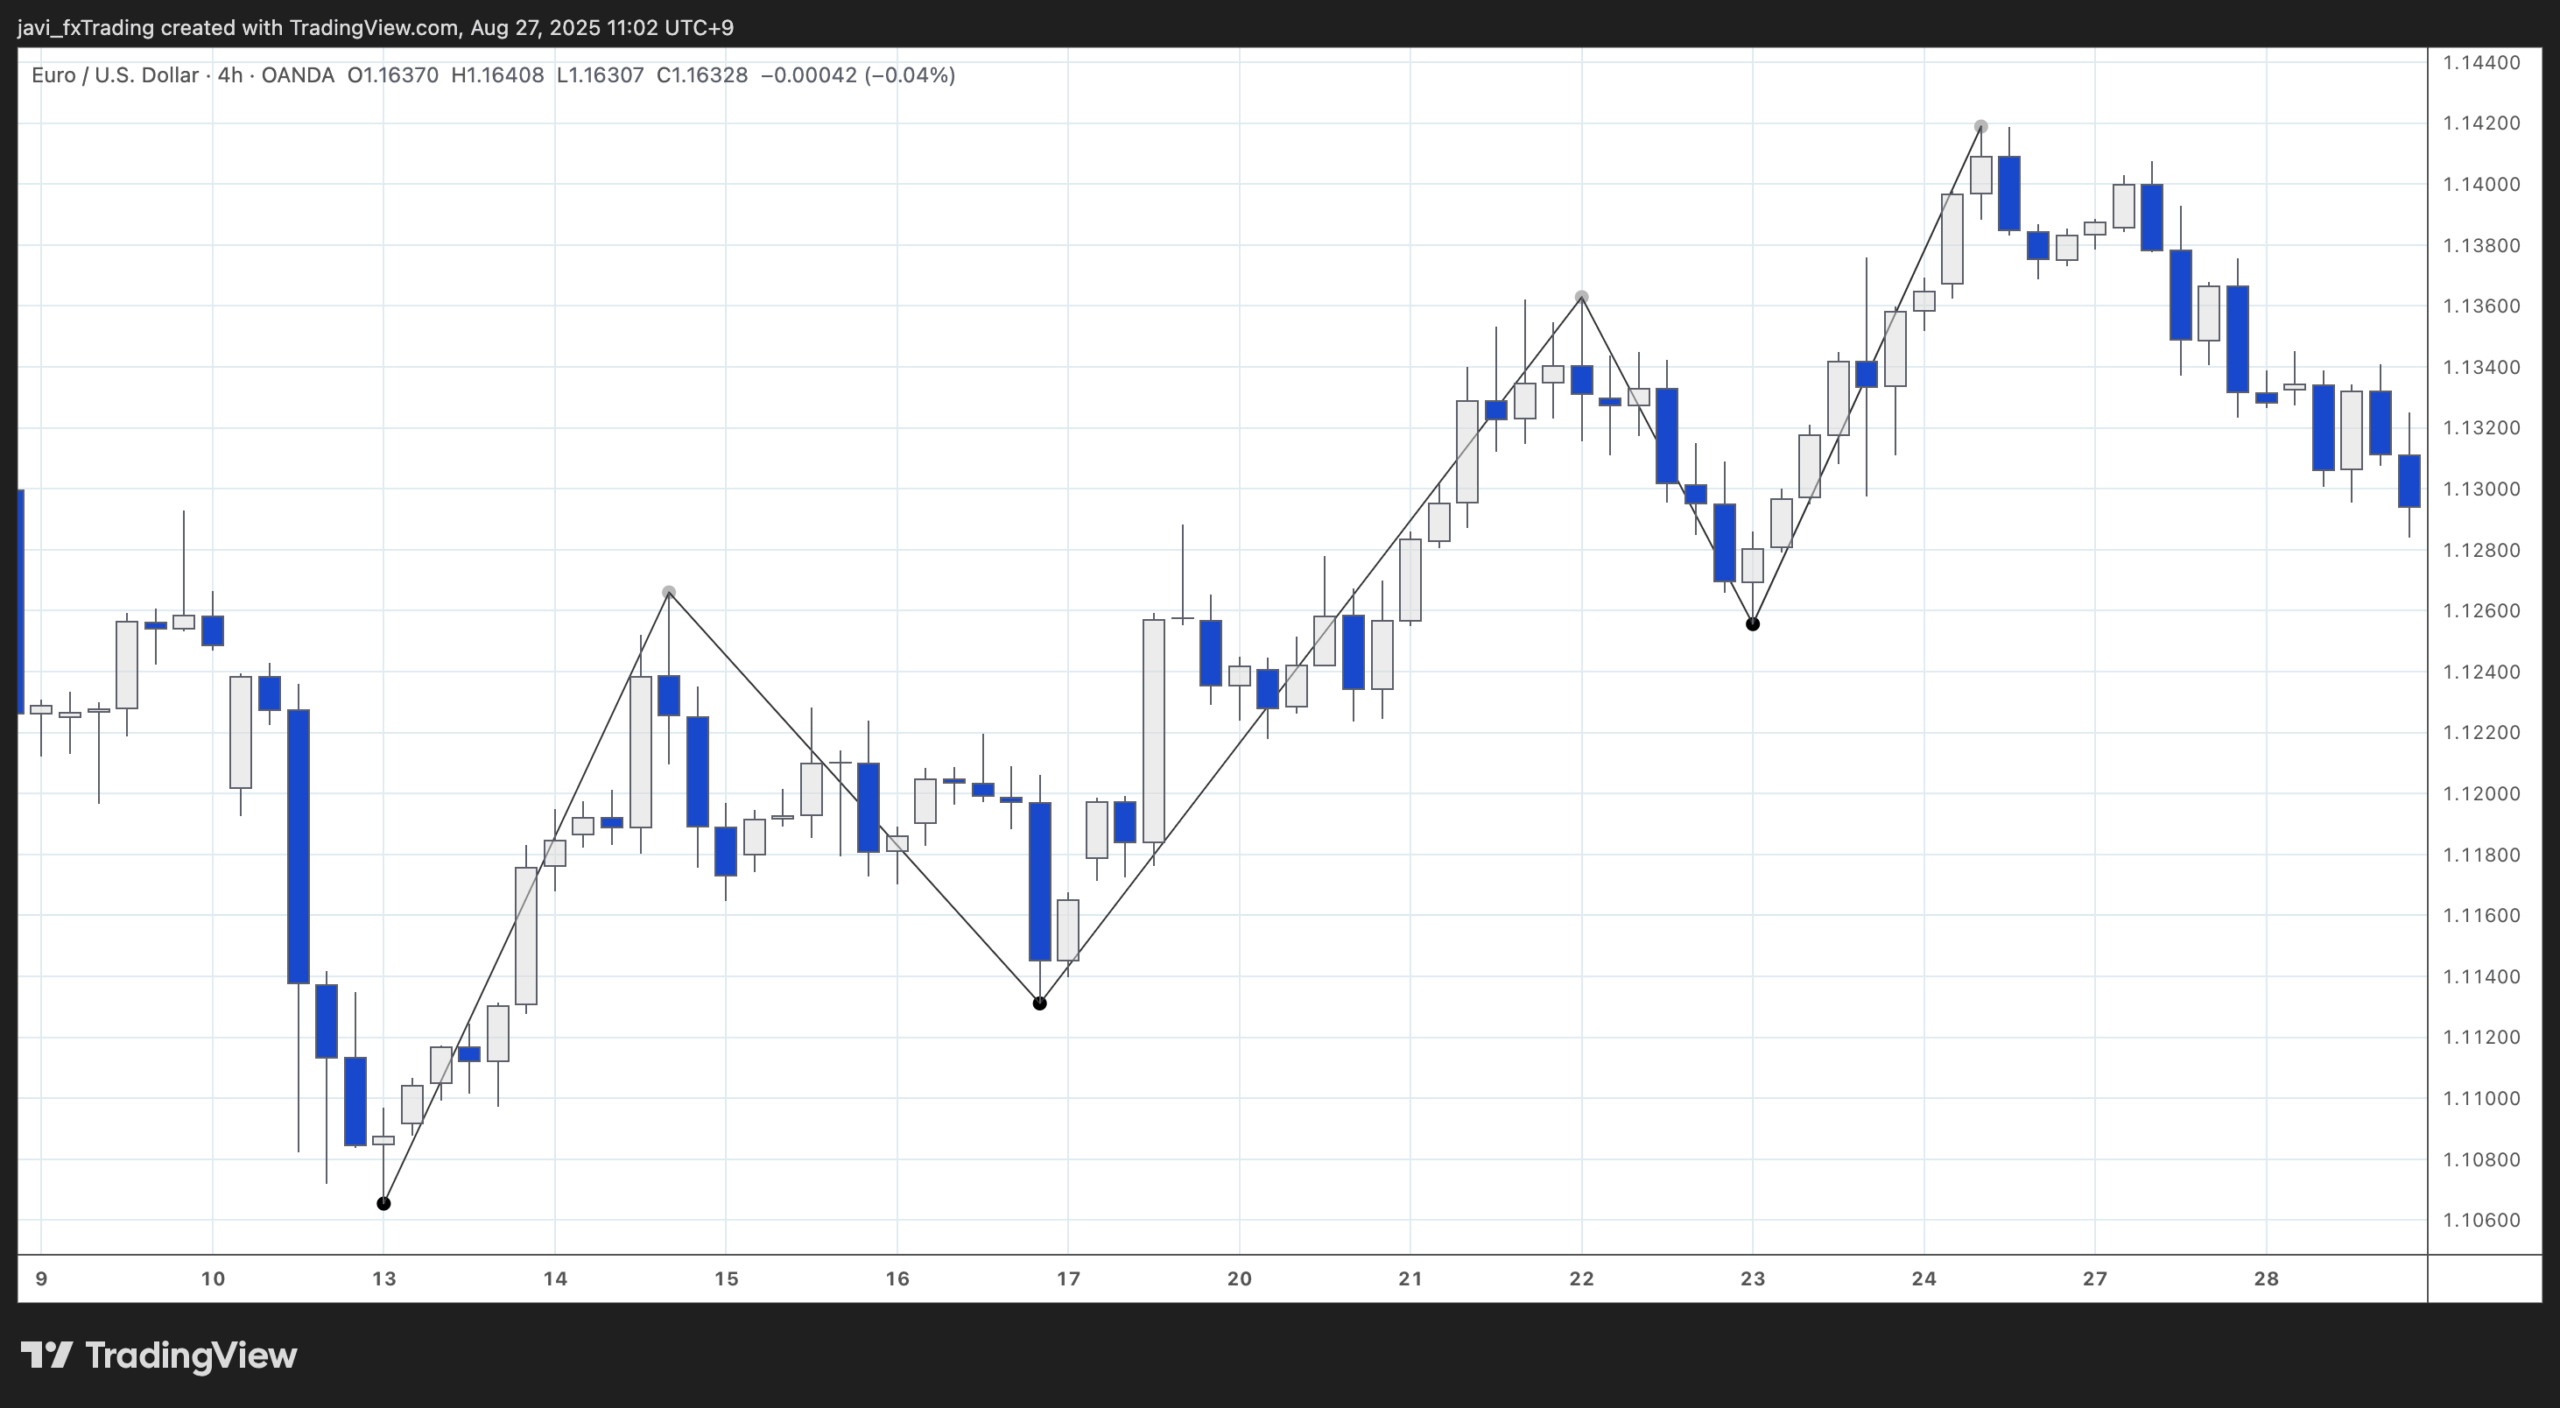
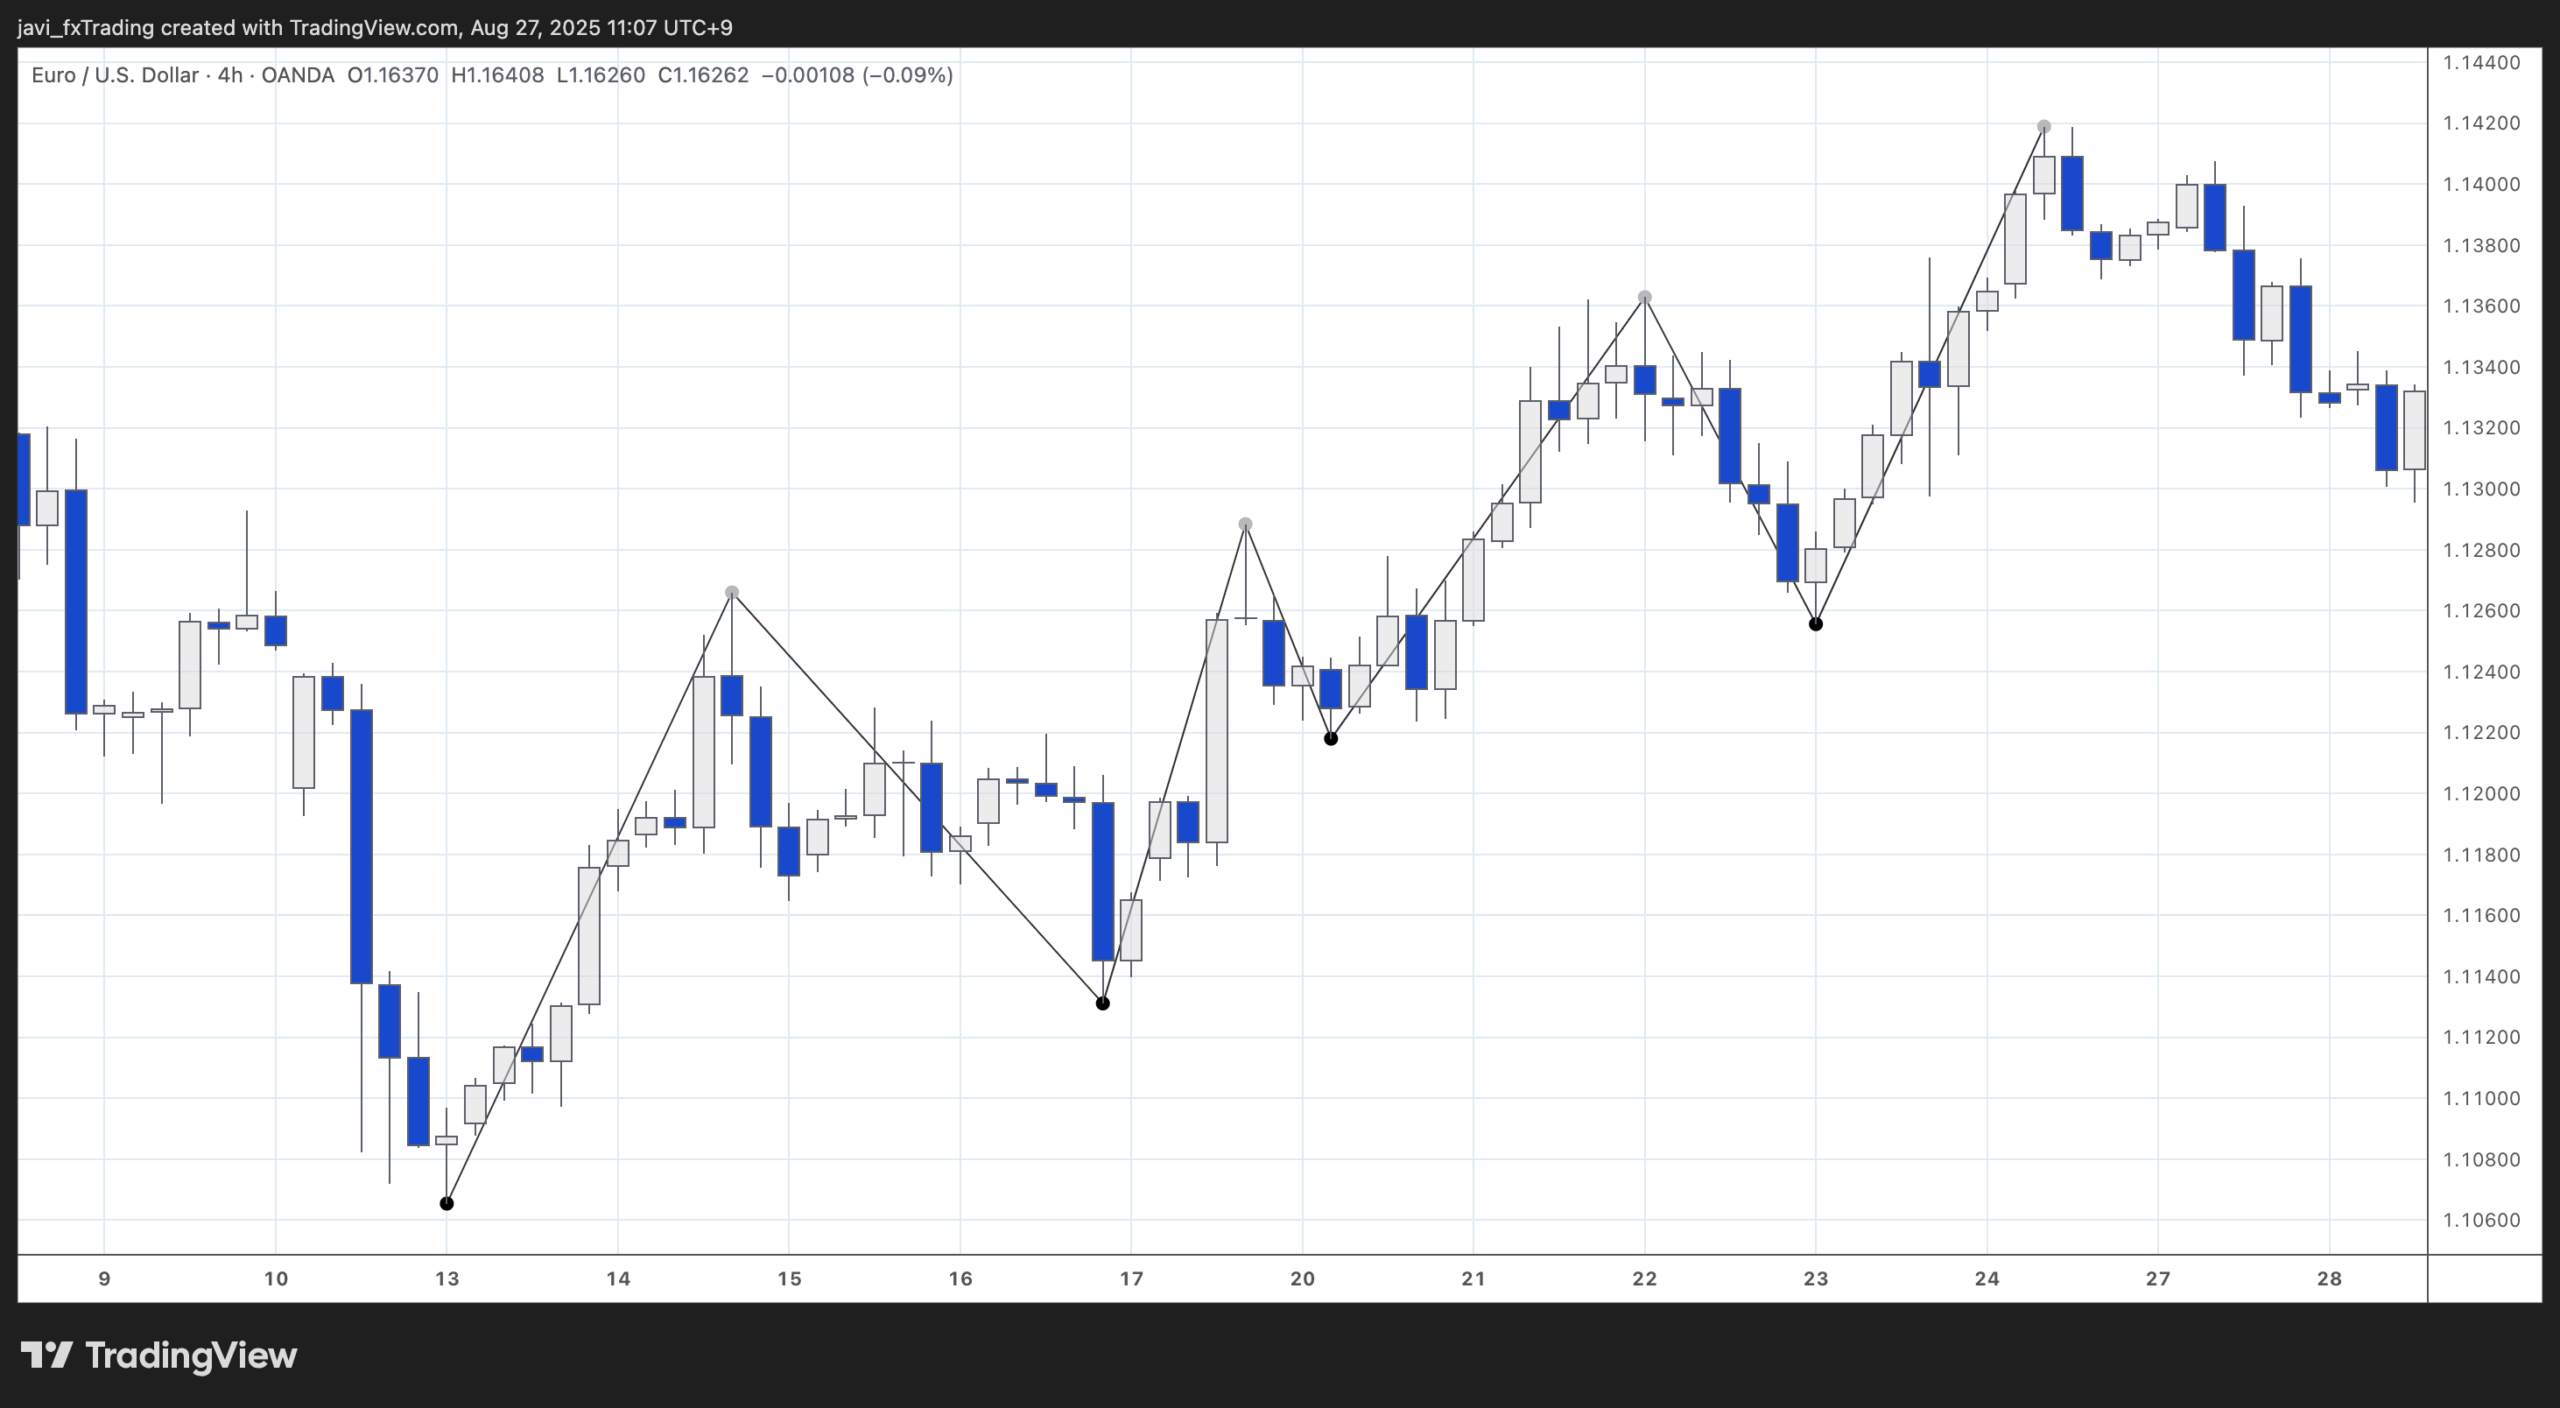
As you may have noticed, the structure could be mapped differently depending on how strictly you define it or whether you use a pip-based rule. Below a slightly tighter structure mapping can be seen:
In this other example we can see swing and internal structure together:
The internal structure may show bullish trends within the bearish swing structure. This will be helpful later on when identifying end of pullbacks and entry points.
Strong Swings vs Weak Swings
- A strong swing low is a swing low that has broken swing structure to the left.
- A weak swing high is a swing high that fails to break swing structure to the left.
- A break of structure (BoS) is when a strong swing takes a weak swing creating the next leg of the trend.
To make it more clear, let’s look at the following example:
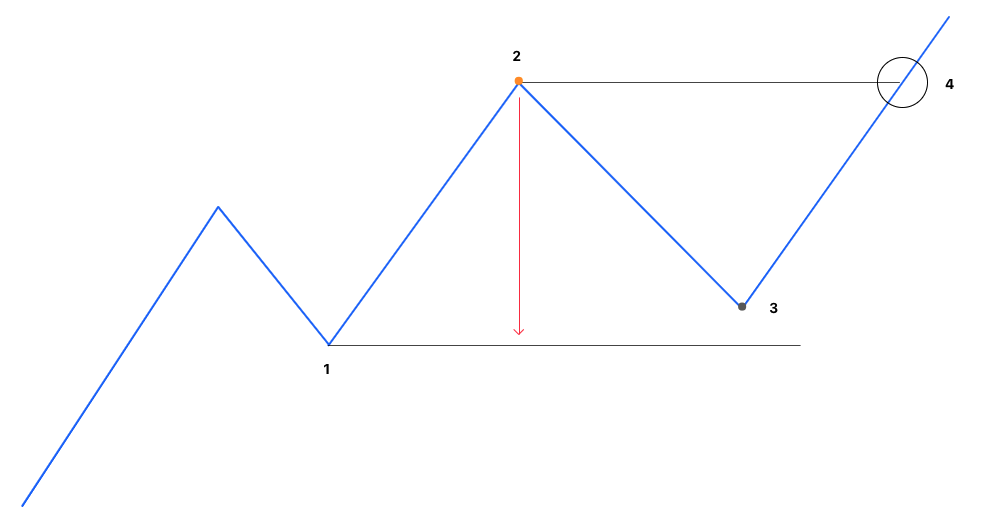
In the image above, we start with a swing low at point (1). Price then moves higher and reaches point (2), forming a new swing high in this bullish trend. A pullback follows to point (3), but it does not break below the low at (1). Because point (2) fails to break that previous low, it’s considered a weak swing high.
From point (3), price rallies again and breaks above the high at point (2) (BoS), reaching point (4). Since point (3) causes a break of swing structure to the left (at point 2), we refer to it as a strong swing low.
The same logic applies in bearish trends, where a strong swing high is one that breaks below a previous weak swing low.
Change Of Character
A Change of Character (CHoCH) marks a potential shift in market sentiment and often signals the end of a current trend or the beginning of a reversal.
In a bullish trend, a CHoCH occurs when a weak swing high is followed by a break of a strong swing low, indicating that buyers may be losing control.
Conversely, in a bearish trend, a CHoCH happens when a weak swing low is followed by a break of a strong swing high, suggesting that sellers are losing momentum.
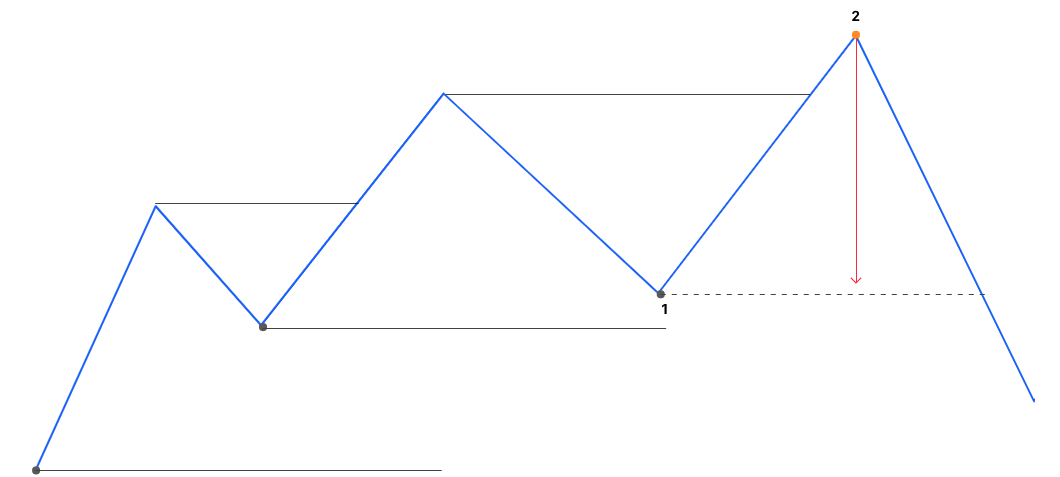
In the chart above, a strong swing low at point (1) initiates a new bullish leg, which sets a higher high at point (2). However, price then pulls back and breaks below the strong swing low at (1), signaling a Change of Character (CHoCH). At this point, the bullish trend is compromised. If price then forms a lower high, it would confirm the transition into a new bearish trend.
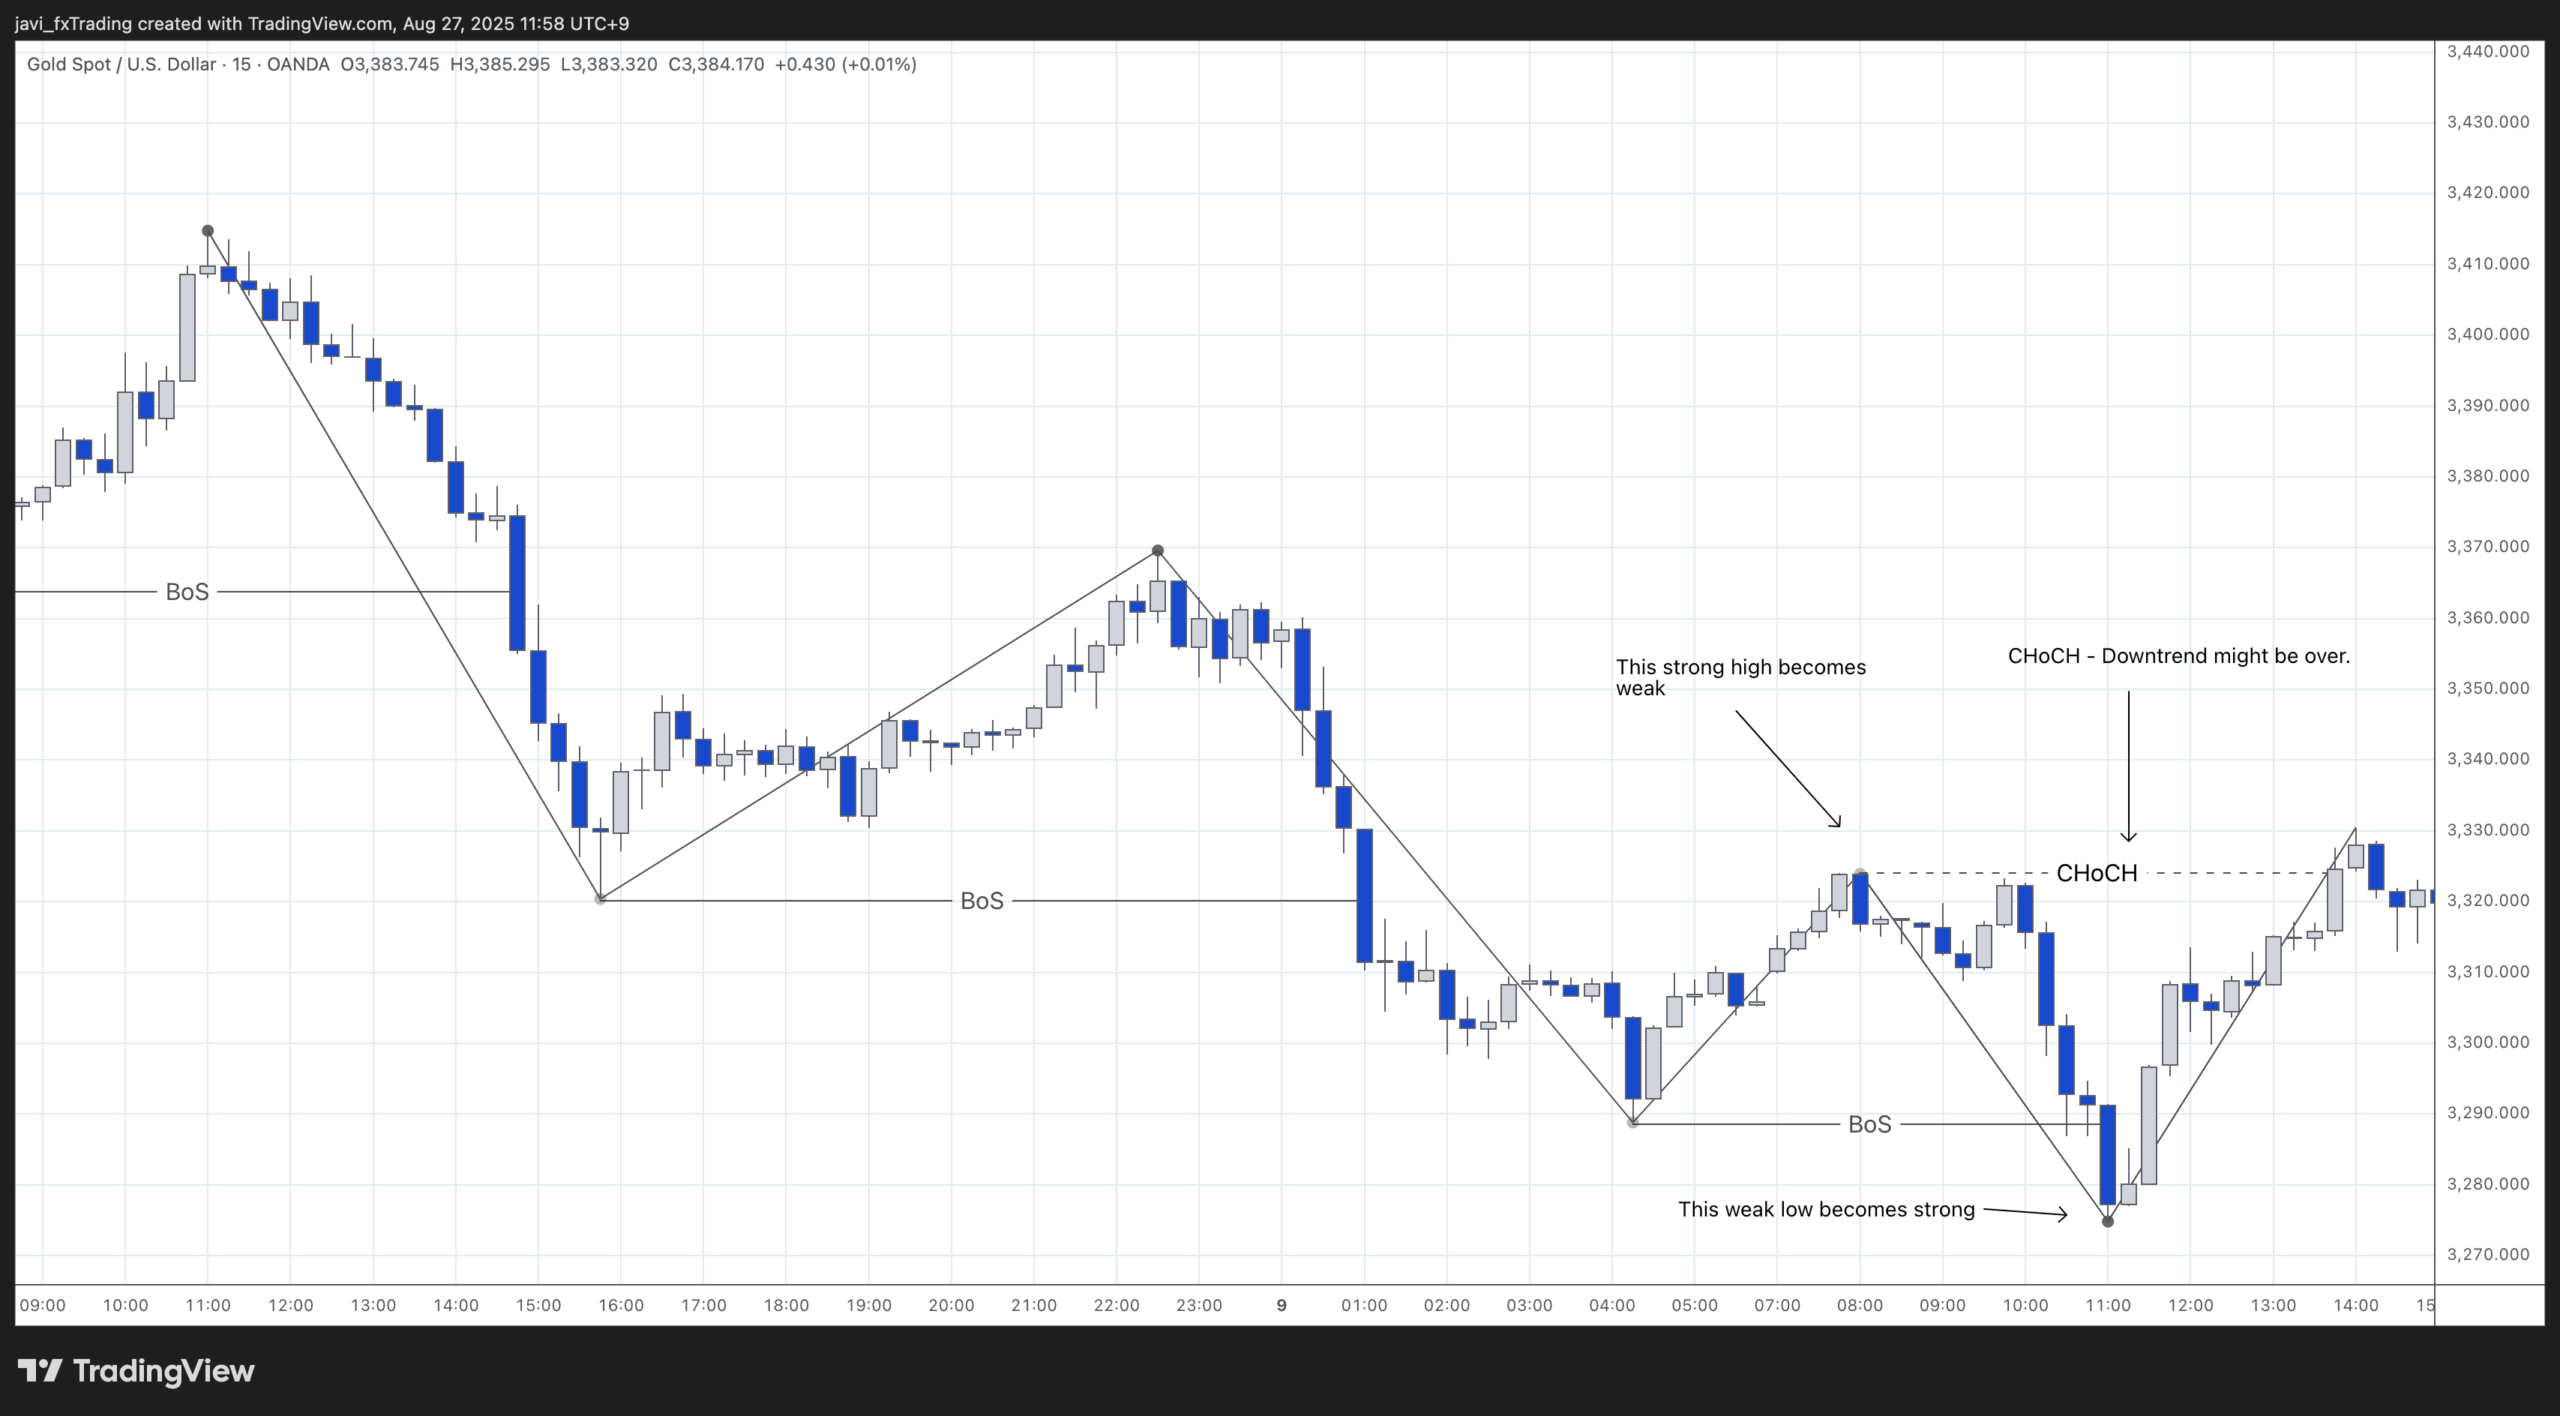
The chart above illustrates a bearish market structure, with price forming a clear sequence of lower highs and lower lows. After the third break of structure to the downside, price unexpectedly breaks above the most recent strong swing high — signaling a Change of Character (CHoCH) and a potential shift in market sentiment from bearish to bullish.
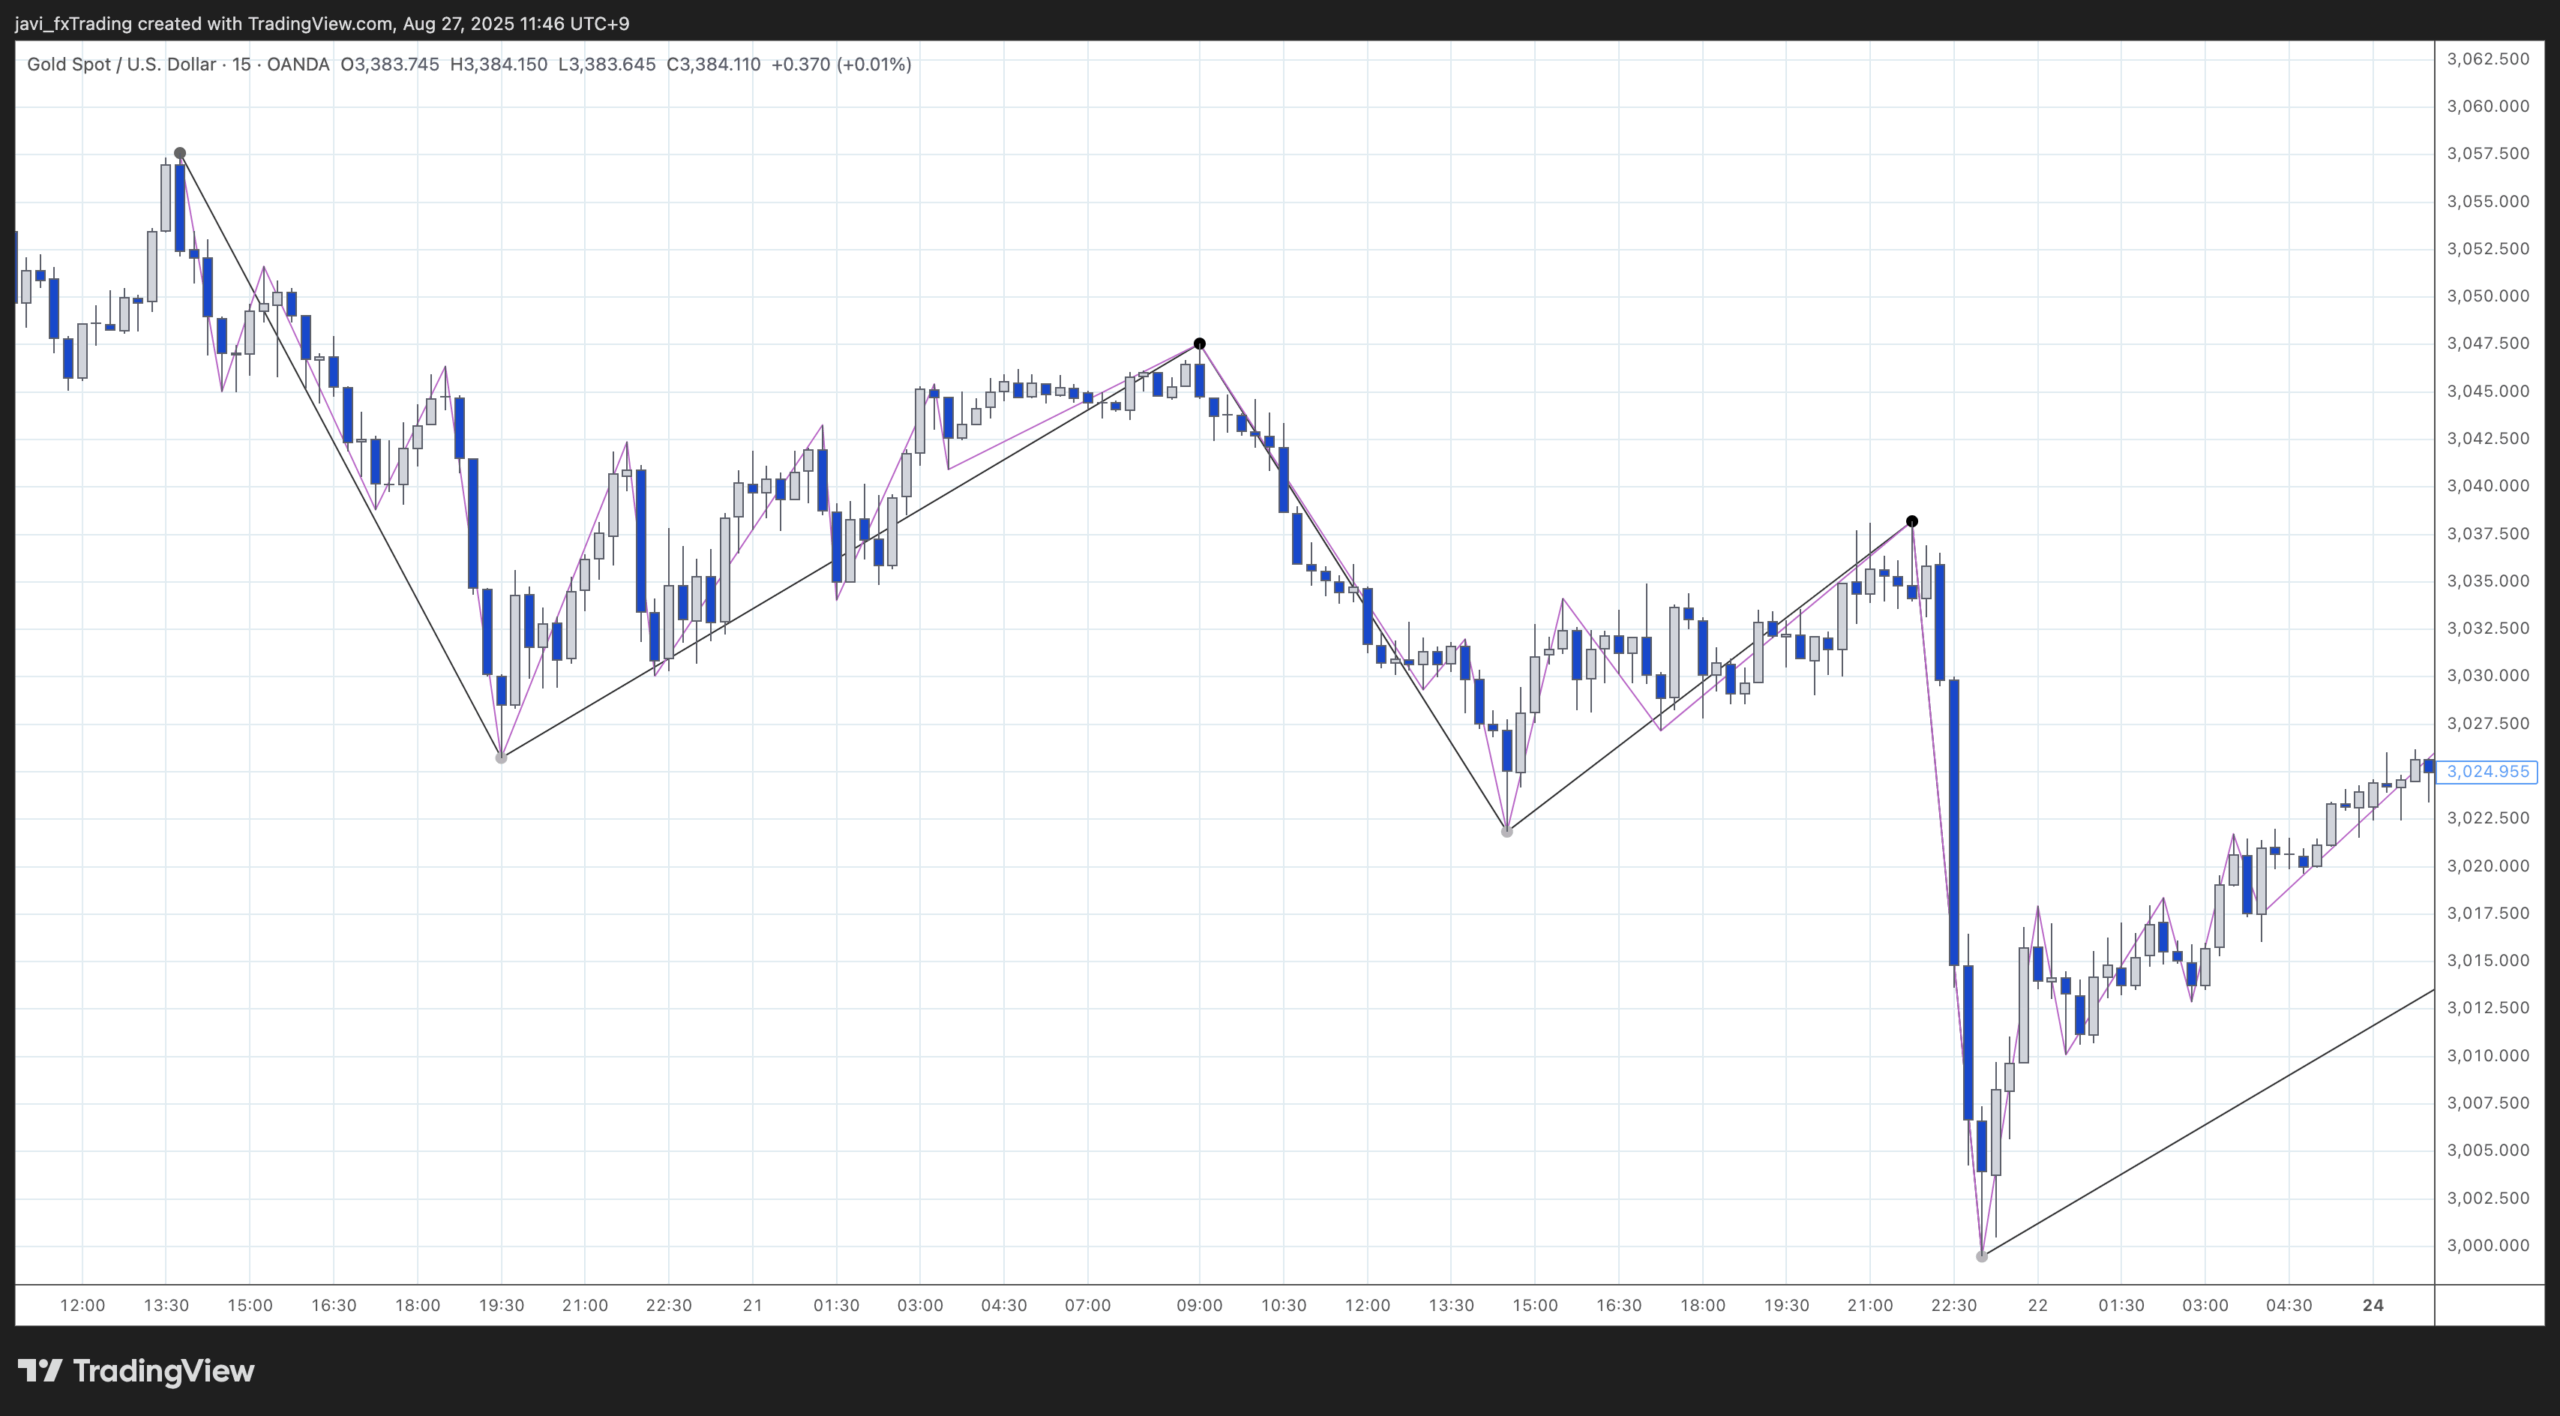
The chart above shows swing and internal structure. The structure mapping is a bit tight so both swing and internal remain aligned throughout this price action but this will not be the case when mapping it looser.
Wrapping Up Market Structure
Market structure is the framework created by price action — the arrangement of highs, lows, and swings that shows whether the market is trending, ranging, or reversing. Within this structure, we can distinguish between swing structures, which capture the bigger moves, and internal structures, which reflect the smaller shifts inside them. There’s no strict rule for defining either; you can rely on experience with the instrument you’re trading or set a simple guideline, like a minimum pip move. Getting comfortable with both the overall market structure and the swings within it makes it much easier to read the market and spot potential trends.
