
| Strategy | London Open Liquidity Sweep |
|---|---|
| Instrument | German Index (DAX) CFD (Oanda – DE30EUR or equivalent) |
| Timeframe | 15m |
| Backtesting Period | 11th February 2025 – 20th August 2025 |
| Starting balance | $100,000 |
| Risk per trade | 0.5% adjusted monthly |
Performance Summary
| Trades | Win | Loss | %Win | Profit Ratio | Win Streak | Losing Streak | Drawdown |
|---|---|---|---|---|---|---|---|
| 53 | 35 | 18 | 66% | 3.37 | 9 | 3 | 2.25% |
Monthly Performance
| Month | Trades | Win | Loss | Total R:R | Risk per Trade | Profit | Balance | Acc. Profit |
|---|---|---|---|---|---|---|---|---|
| February | 5 | 4 | 1 | 6.5 | $500 | $3,250 | $103,250 | $3,250 |
| March | 6 | 3 | 3 | 2.0 | $516 | $1,032 | $104,282 | $4,282 |
| April | 10 | 5 | 5 | 4.5 | $521 | $2,346 | $106,628 | $6,628 |
| May | 8 | 6 | 2 | 8.0 | $533 | $4,265 | $110,893 | $10,893 |
| June | 10 | 4 | 6 | 1.5 | $554 | $831 | $111,725 | $11,725 |
| July | 6 | 6 | 0 | 10.0 | $558 | $5,586 | $117,311 | $17,311 |
| August | 9 | 7 | 2 | 10.25 | $586 | $6,012 | $123,324 | $23,324 |
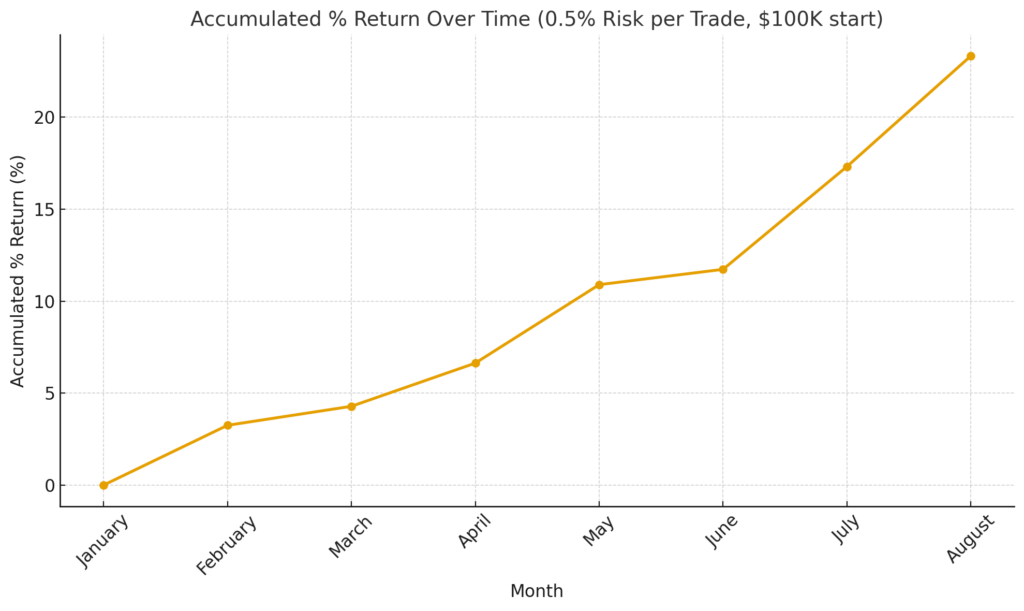
Total return for 6 months: 23%, 42.75R
Accumulated % Return
Sample Trades
13th of March 2025 – Win
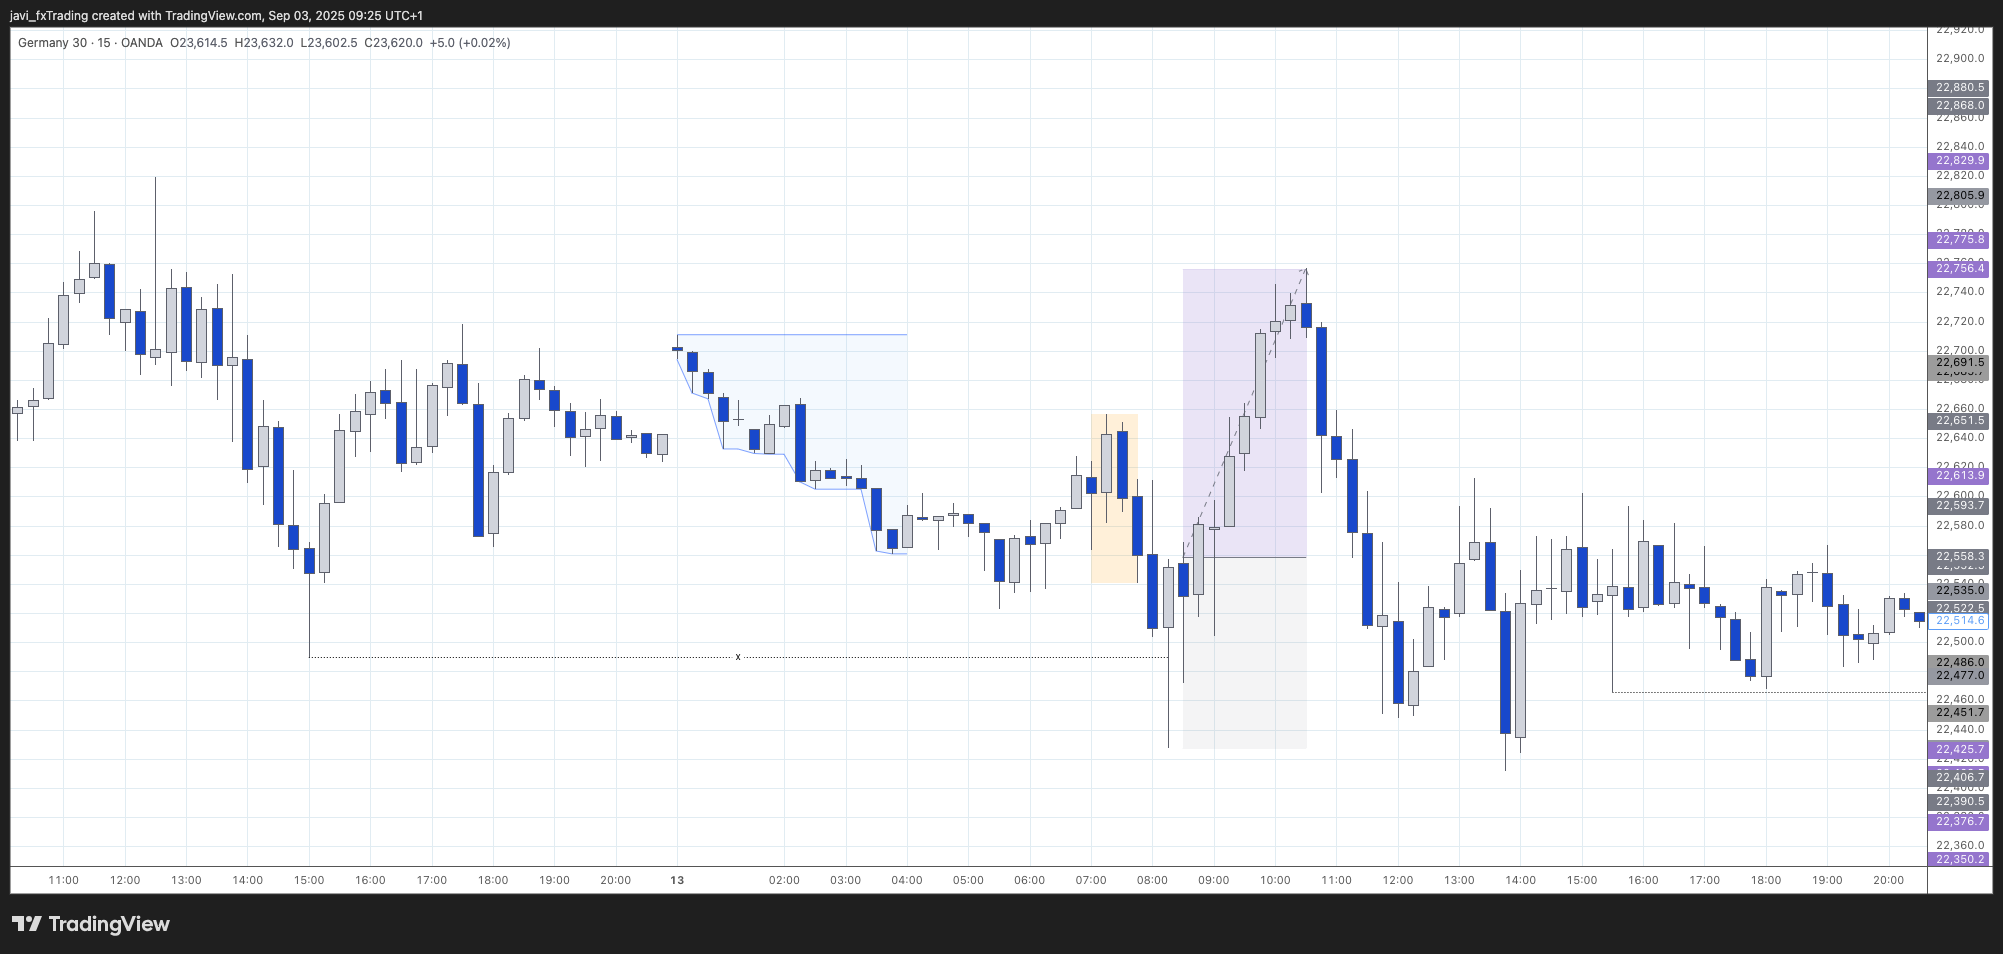
The 8:15 candle sweeps liquidity and reverses with a long wick. Since it closes bullish (price dipped first to grab liquidity), we take the trade on the break of its high. The 1.5R target is a bit tight depending on spreads, but it plays out—a clean example of a winning trade.
After our trade completes, price runs higher, grabs additional buy-side liquidity, and then reverses sharply. However, since this occurs beyond the first 1–2 hours of the London session, it doesn’t qualify for the strategy; the liquidity grab is no longer part of the opening manipulation.
14th of March 2025 – Win
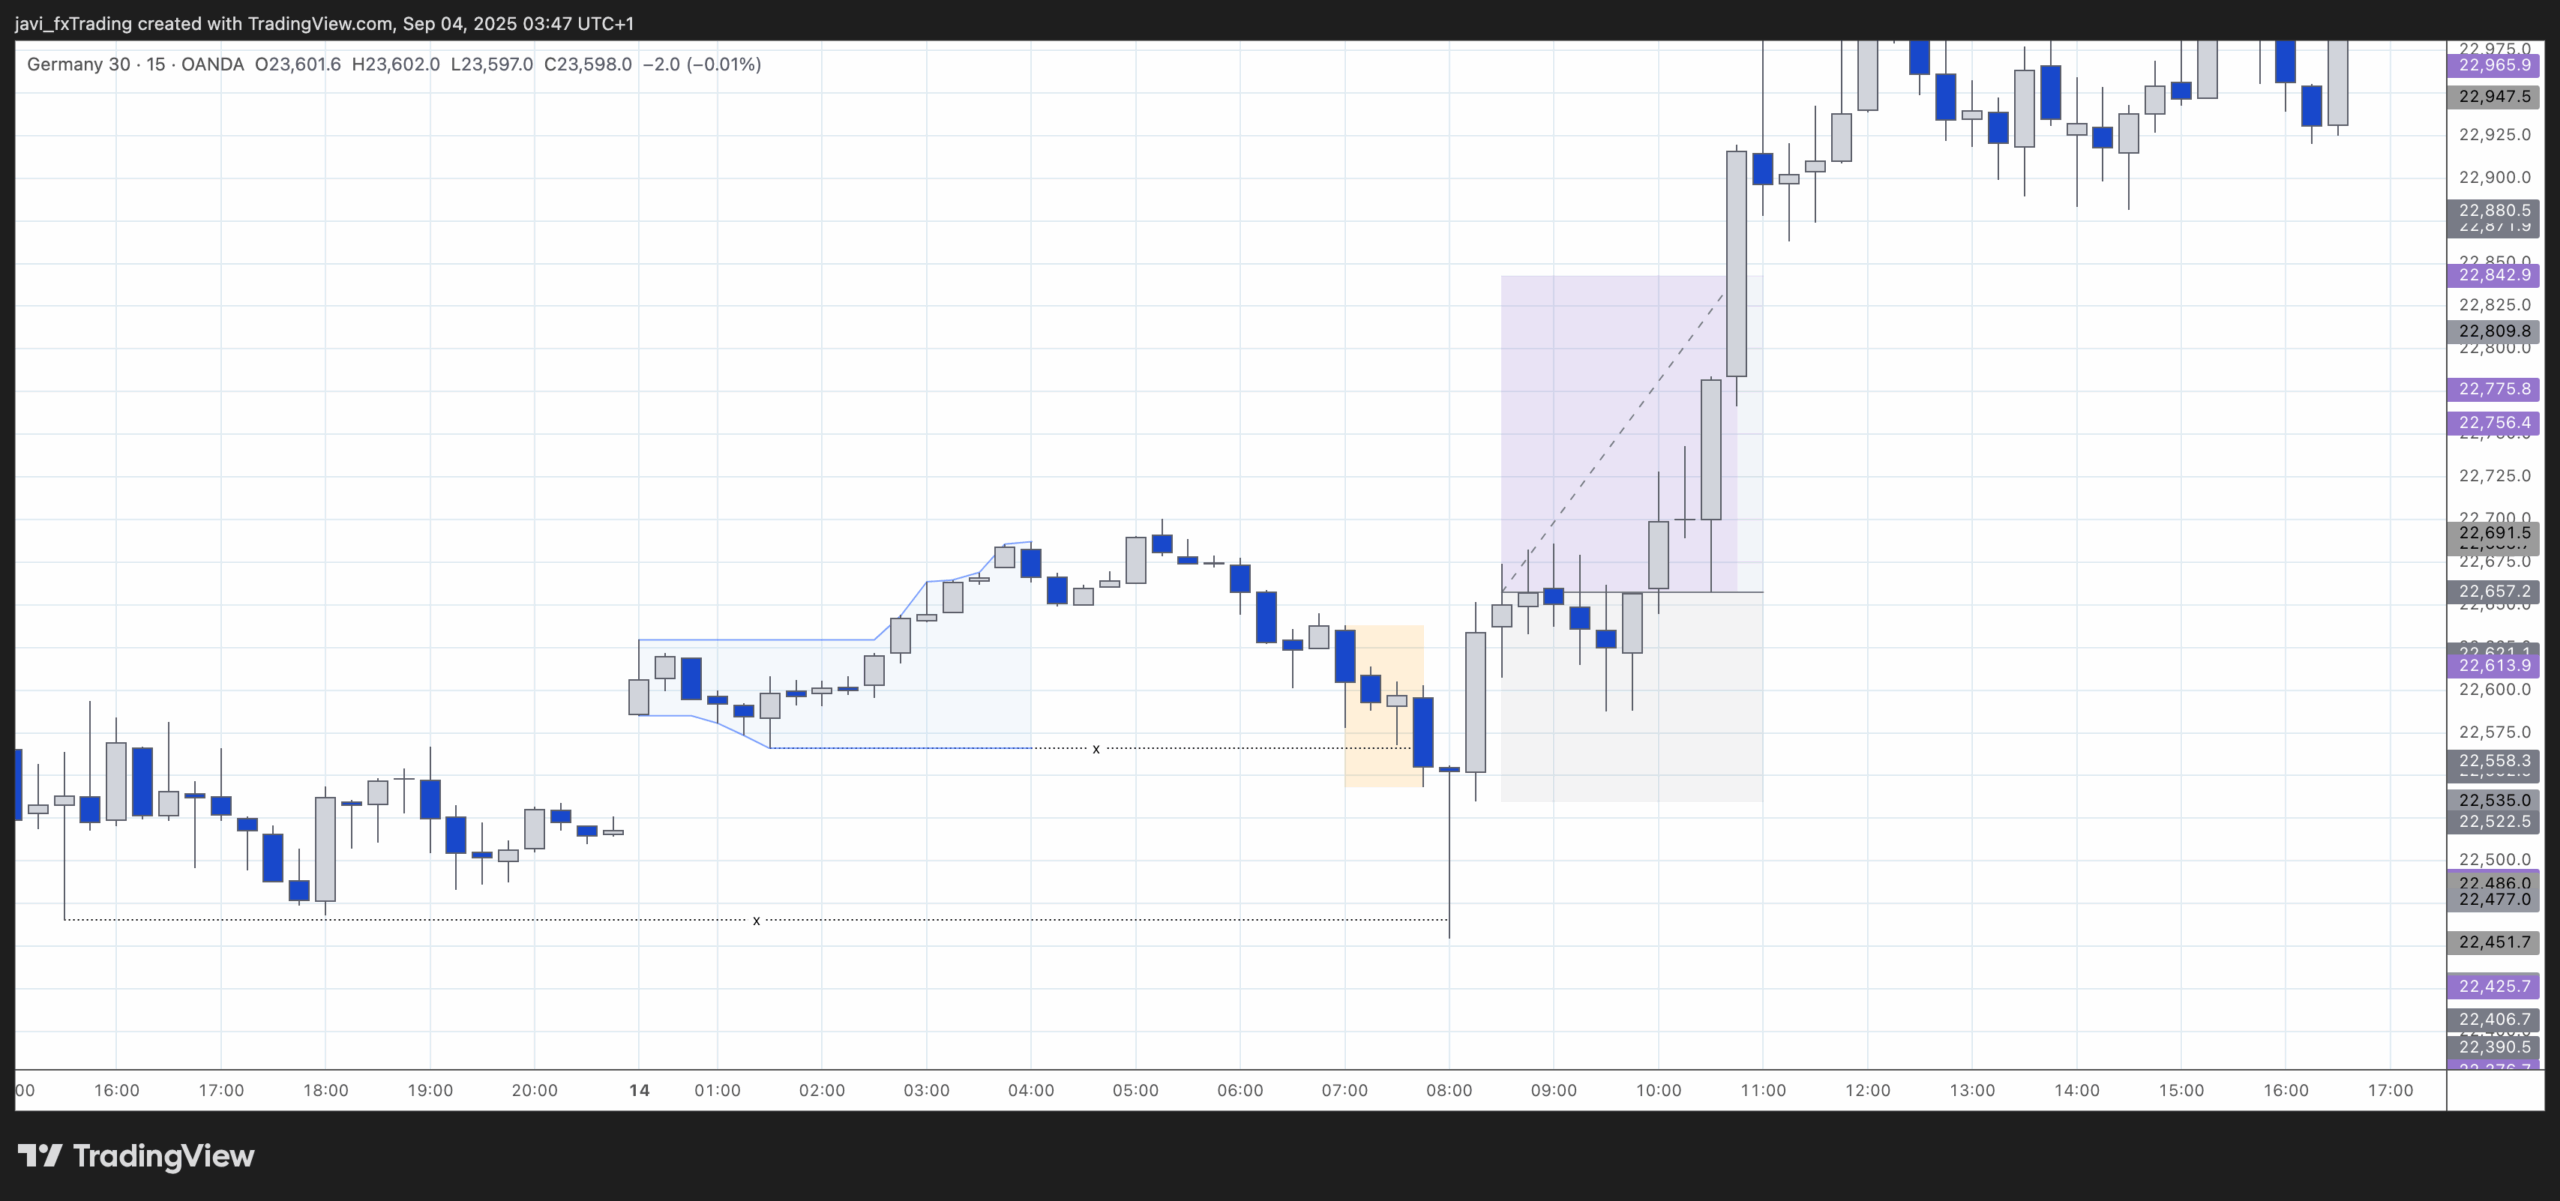
The 8:00 candle, right after the London open, sweeps liquidity to the downside (sell-side liquidity) and leaves a long wick. Despite that, it closes bearish, so we wait for confirmation with the next bullish candle. Once that candle forms, the trade is triggered on the break of its high.
Ideally, the stop should cover the wick of the opening candle, but that would make it too wide. Since the bullish candle is relatively large, we instead place the stop just beneath it. This requires some discretion: covering the previous candle would have worked here, but such setups are rare because the move must be big enough to reach 1.5R.
21st of March 2025 – Loss
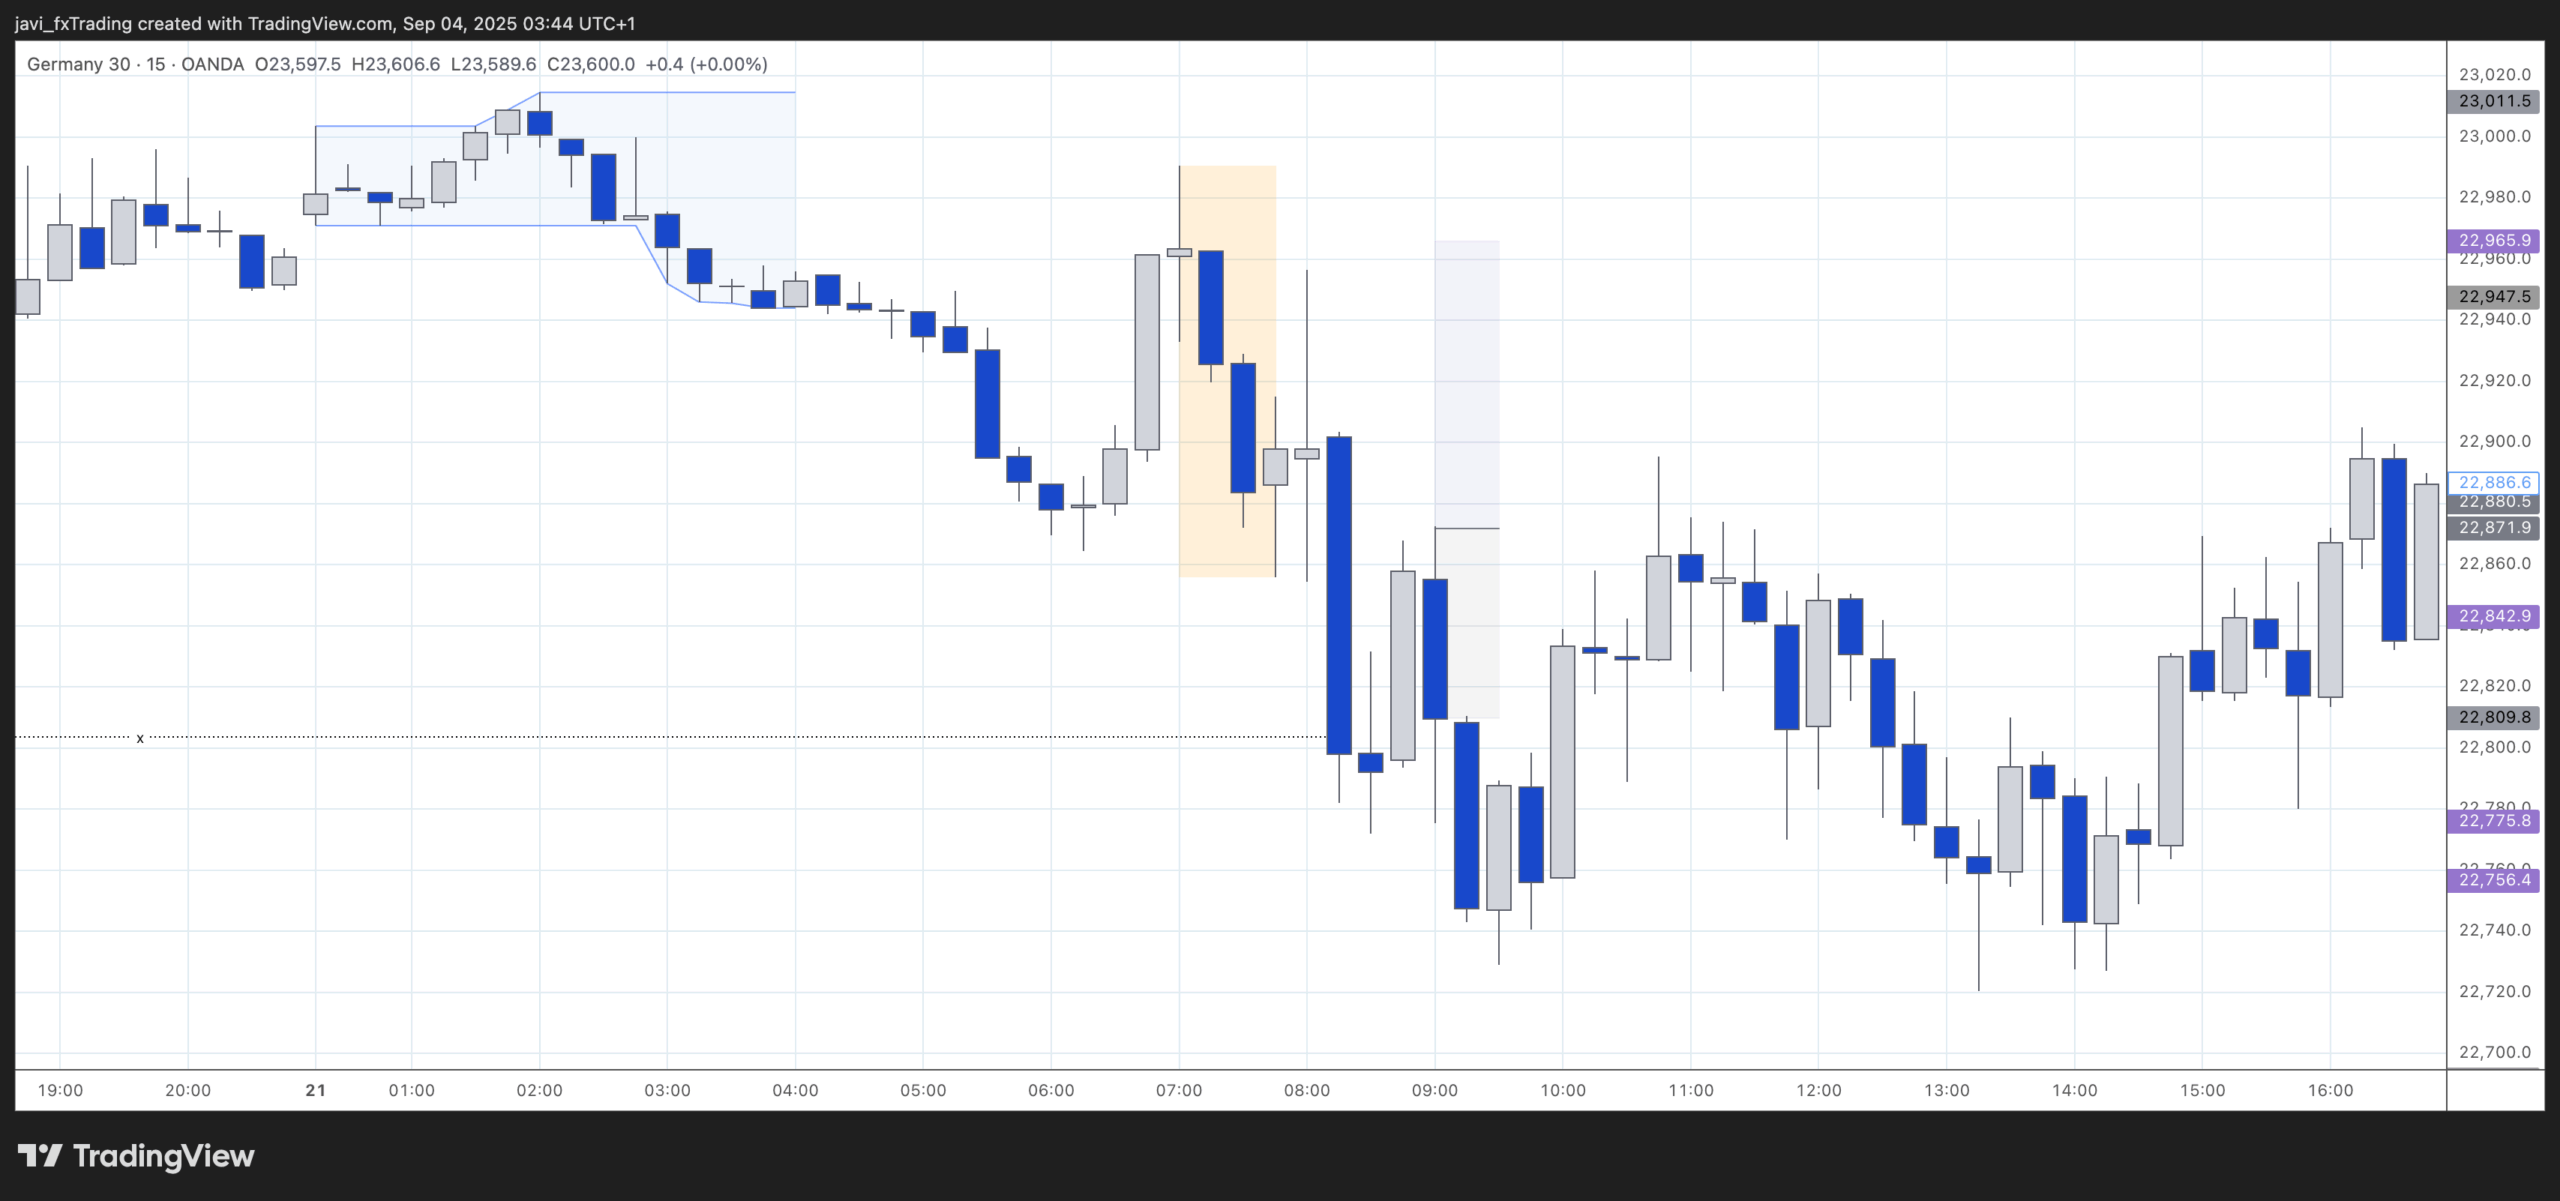
Here’s an example of a losing trade. After an initial indecision candle, the market drops and sweeps liquidity below a previous low, triggering the setup. The 8:45 candle then activates the entry—barely by an inch. Depending on spreads and how close the order is placed to the high of the signal bar, we might not have been tagged at all. Either way, the market continues against us before eventually consolidating.
10th of April 2025 – Invalid setup
I also want to highlight some cases that I consider invalid setups, or simply not present. In the example above, during the London open, the market pushes just above the high of the first hour of the Frankfurt session and then drops sharply. There is a local high within the Asia session (which could be considered taken already by the last candle before London open), but unless very sharp price action occurs within the Asia range, I don’t consider it a valid liquidity sweep. Volumes are typically too low during the Asia session to give much weight to these kinds of local swings.
I also want to point out a case where I would not treat the Asia high as a liquidity sweep, since there is a much clearer high sitting just above it.
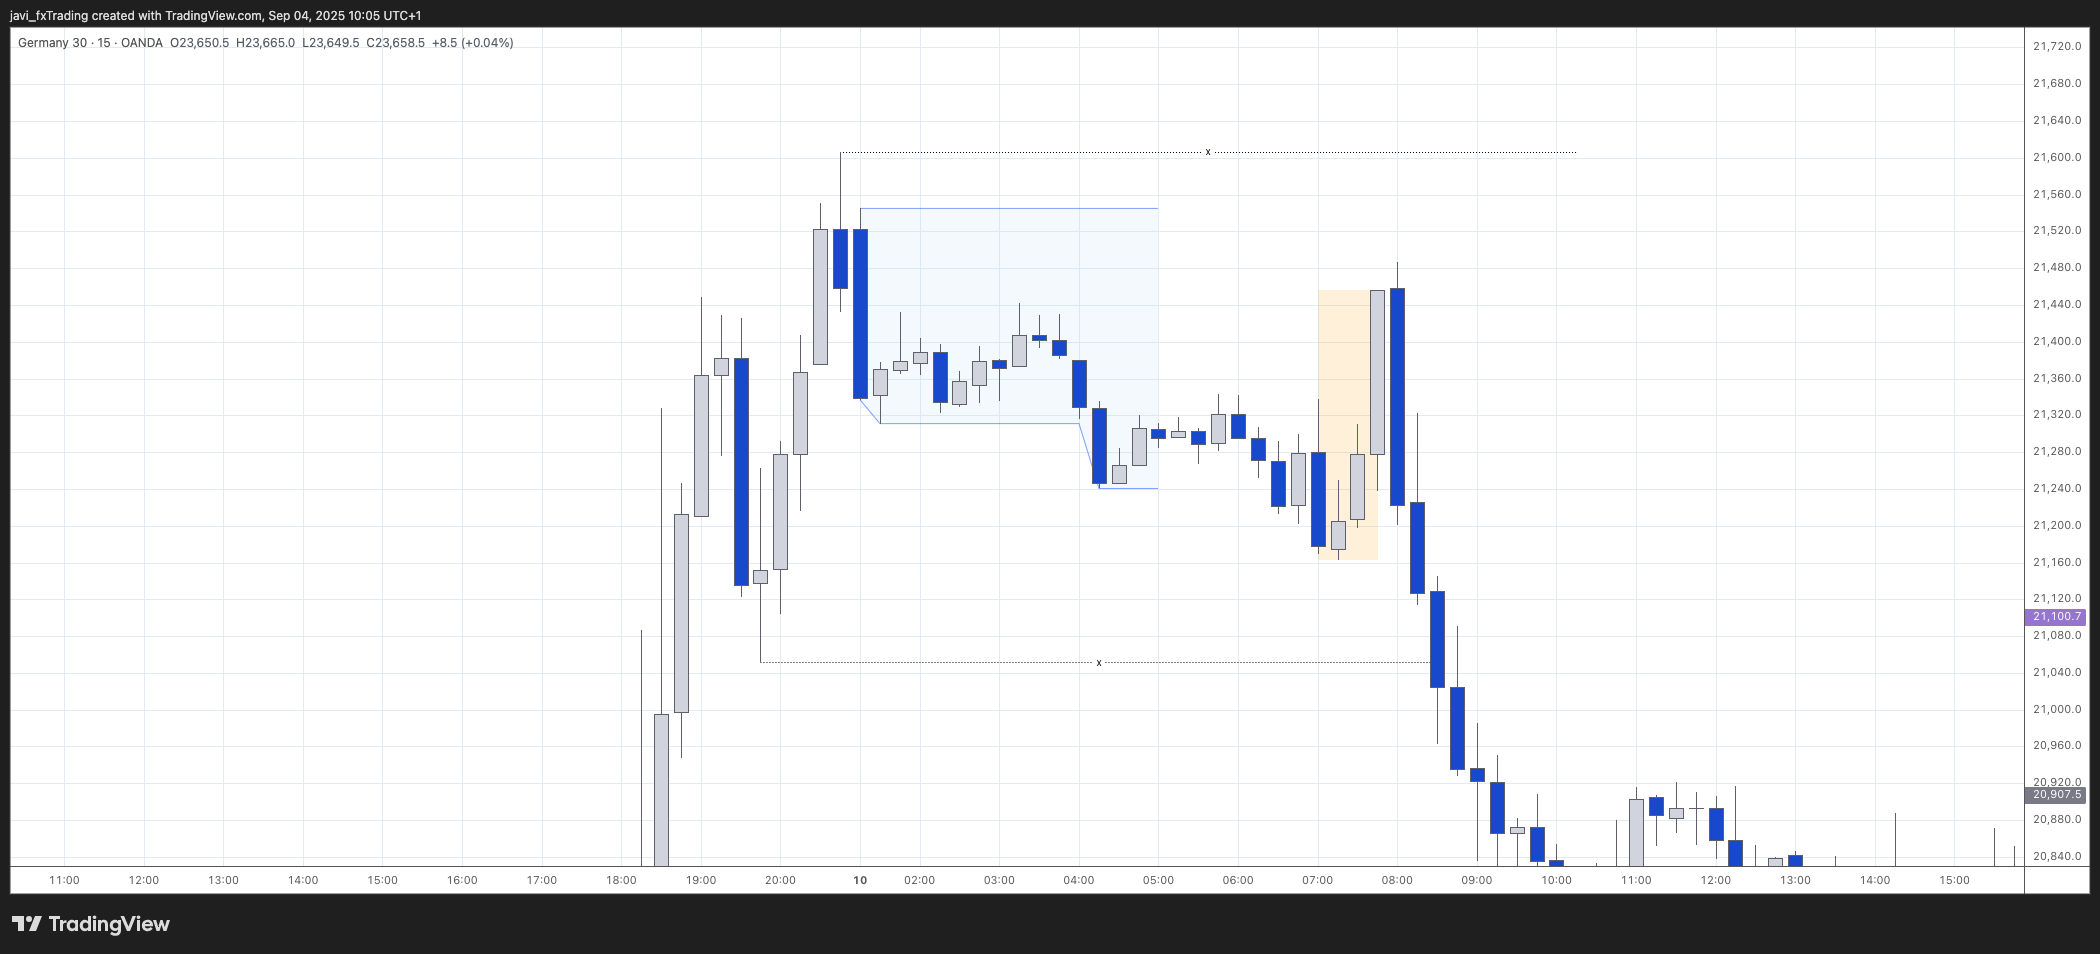
30th of April 2025 – Win
At 8:00, London opens with a strong bullish candle that sweeps buy-side liquidity above the Asia high. A doji follows, closing bearish and serving as our signal bar. The entry is triggered on the break of its low, which happens immediately. The market hesitates for a few hours, but the high—where our stop is placed—remains intact. Shortly after, price drops sharply and our take-profit is hit quickly.
Notice again that after the initial drop, sell-side liquidity is taken. The high of the first bullish candle that follows isn’t breached, and price drops once more. For the setup to be valid, additional liquidity still needs to be cleared. Once that happens, a strong bullish candle prints. This lines up with a possible manipulation around the New York open—a scenario I haven’t tested yet, but in this case it would have worked well.
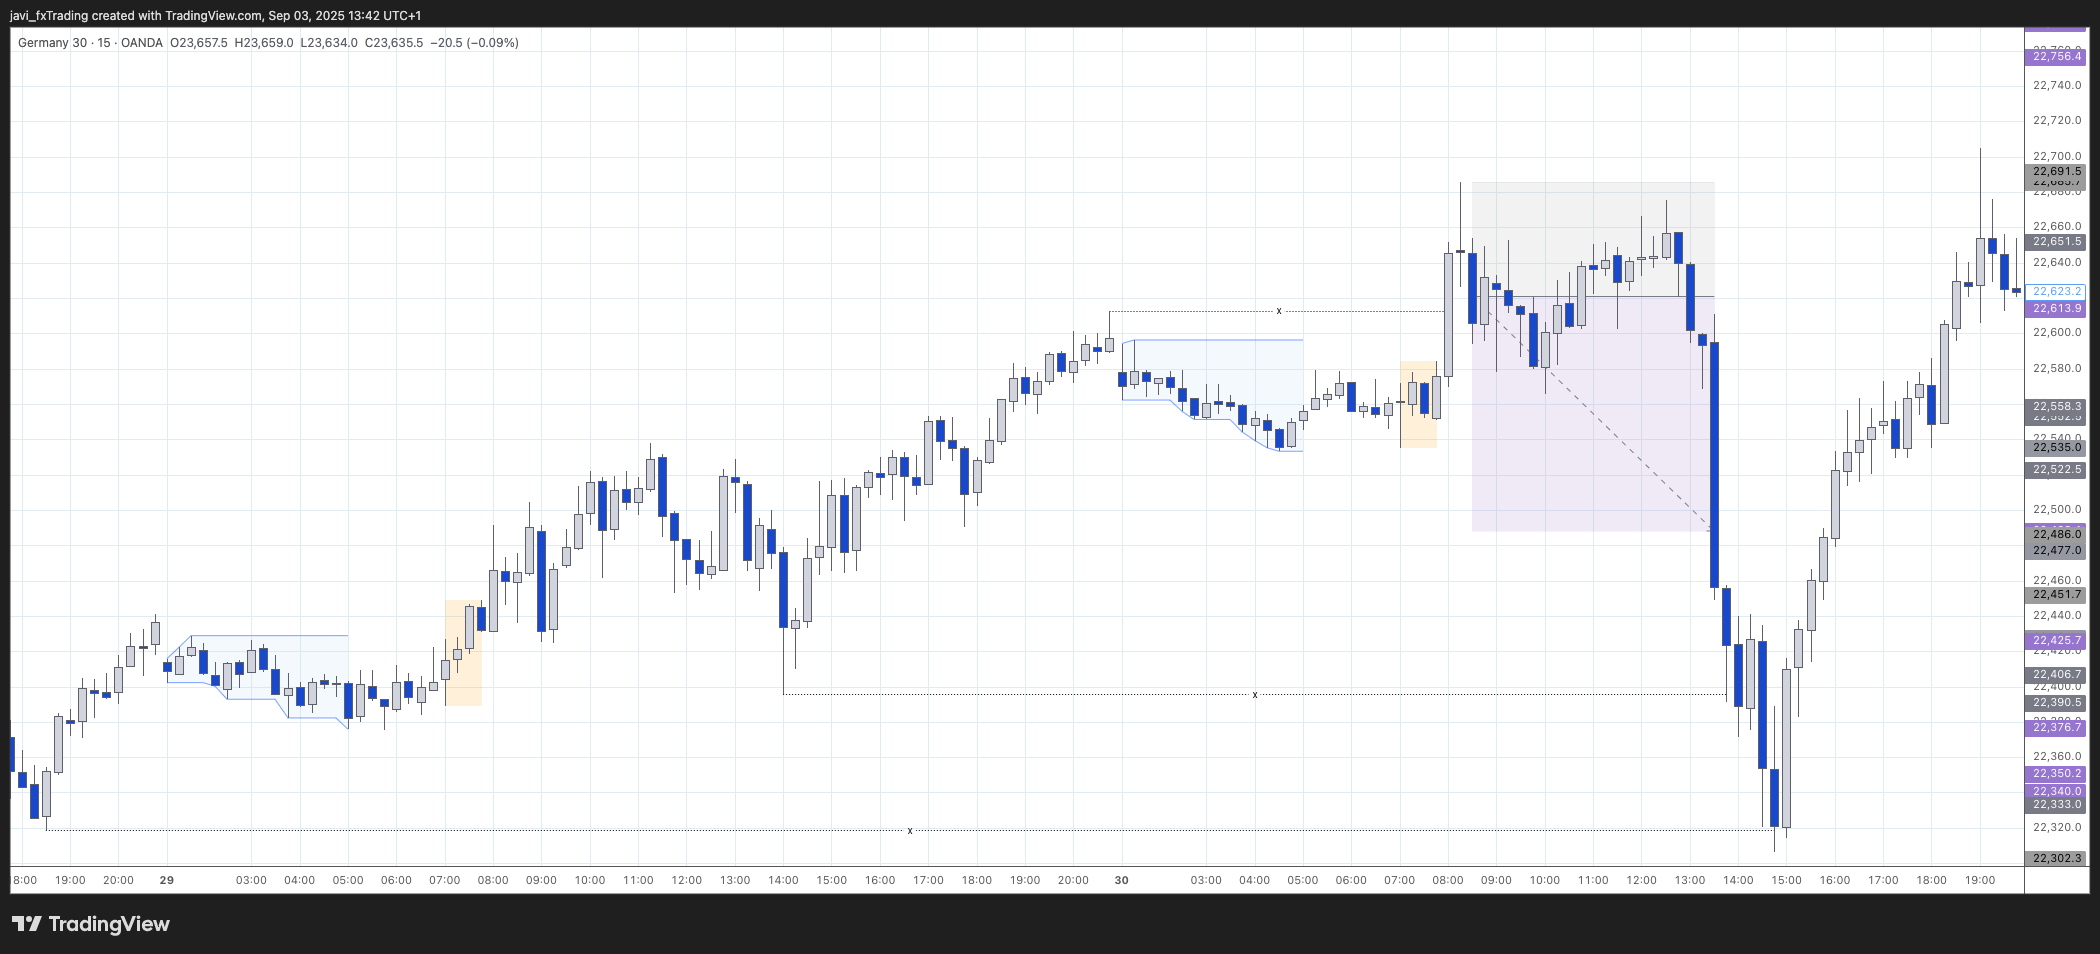
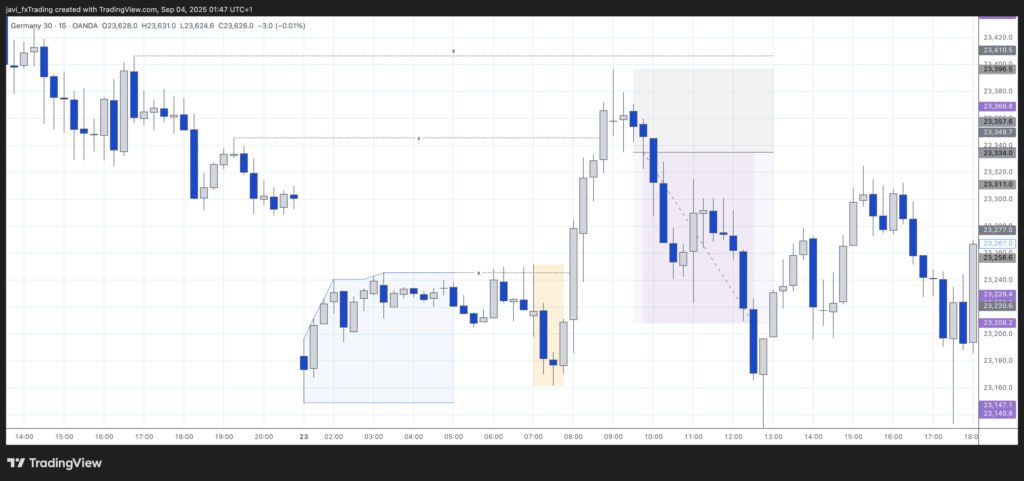
23rd of May 2025 – Loss
After a quiet first hour in Frankfurt, the market pushes strongly and takes out the Asia high. A doji forms, giving us the signal bar. Unfortunately, before sinking lower, price ticks just high enough to stop us out by a whisker.
Originally, the strategy required either a bullish or bearish candle as the signal bar, excluding dojis. However, after re-testing this period, results improved when dojis were also considered valid signal bars. The main drawback was that stop loss can sometimes be too wide (covering both the doji and the signal bar), which makes it harder to hit take profit before a possible reversal.
28th of May 2025 – Win
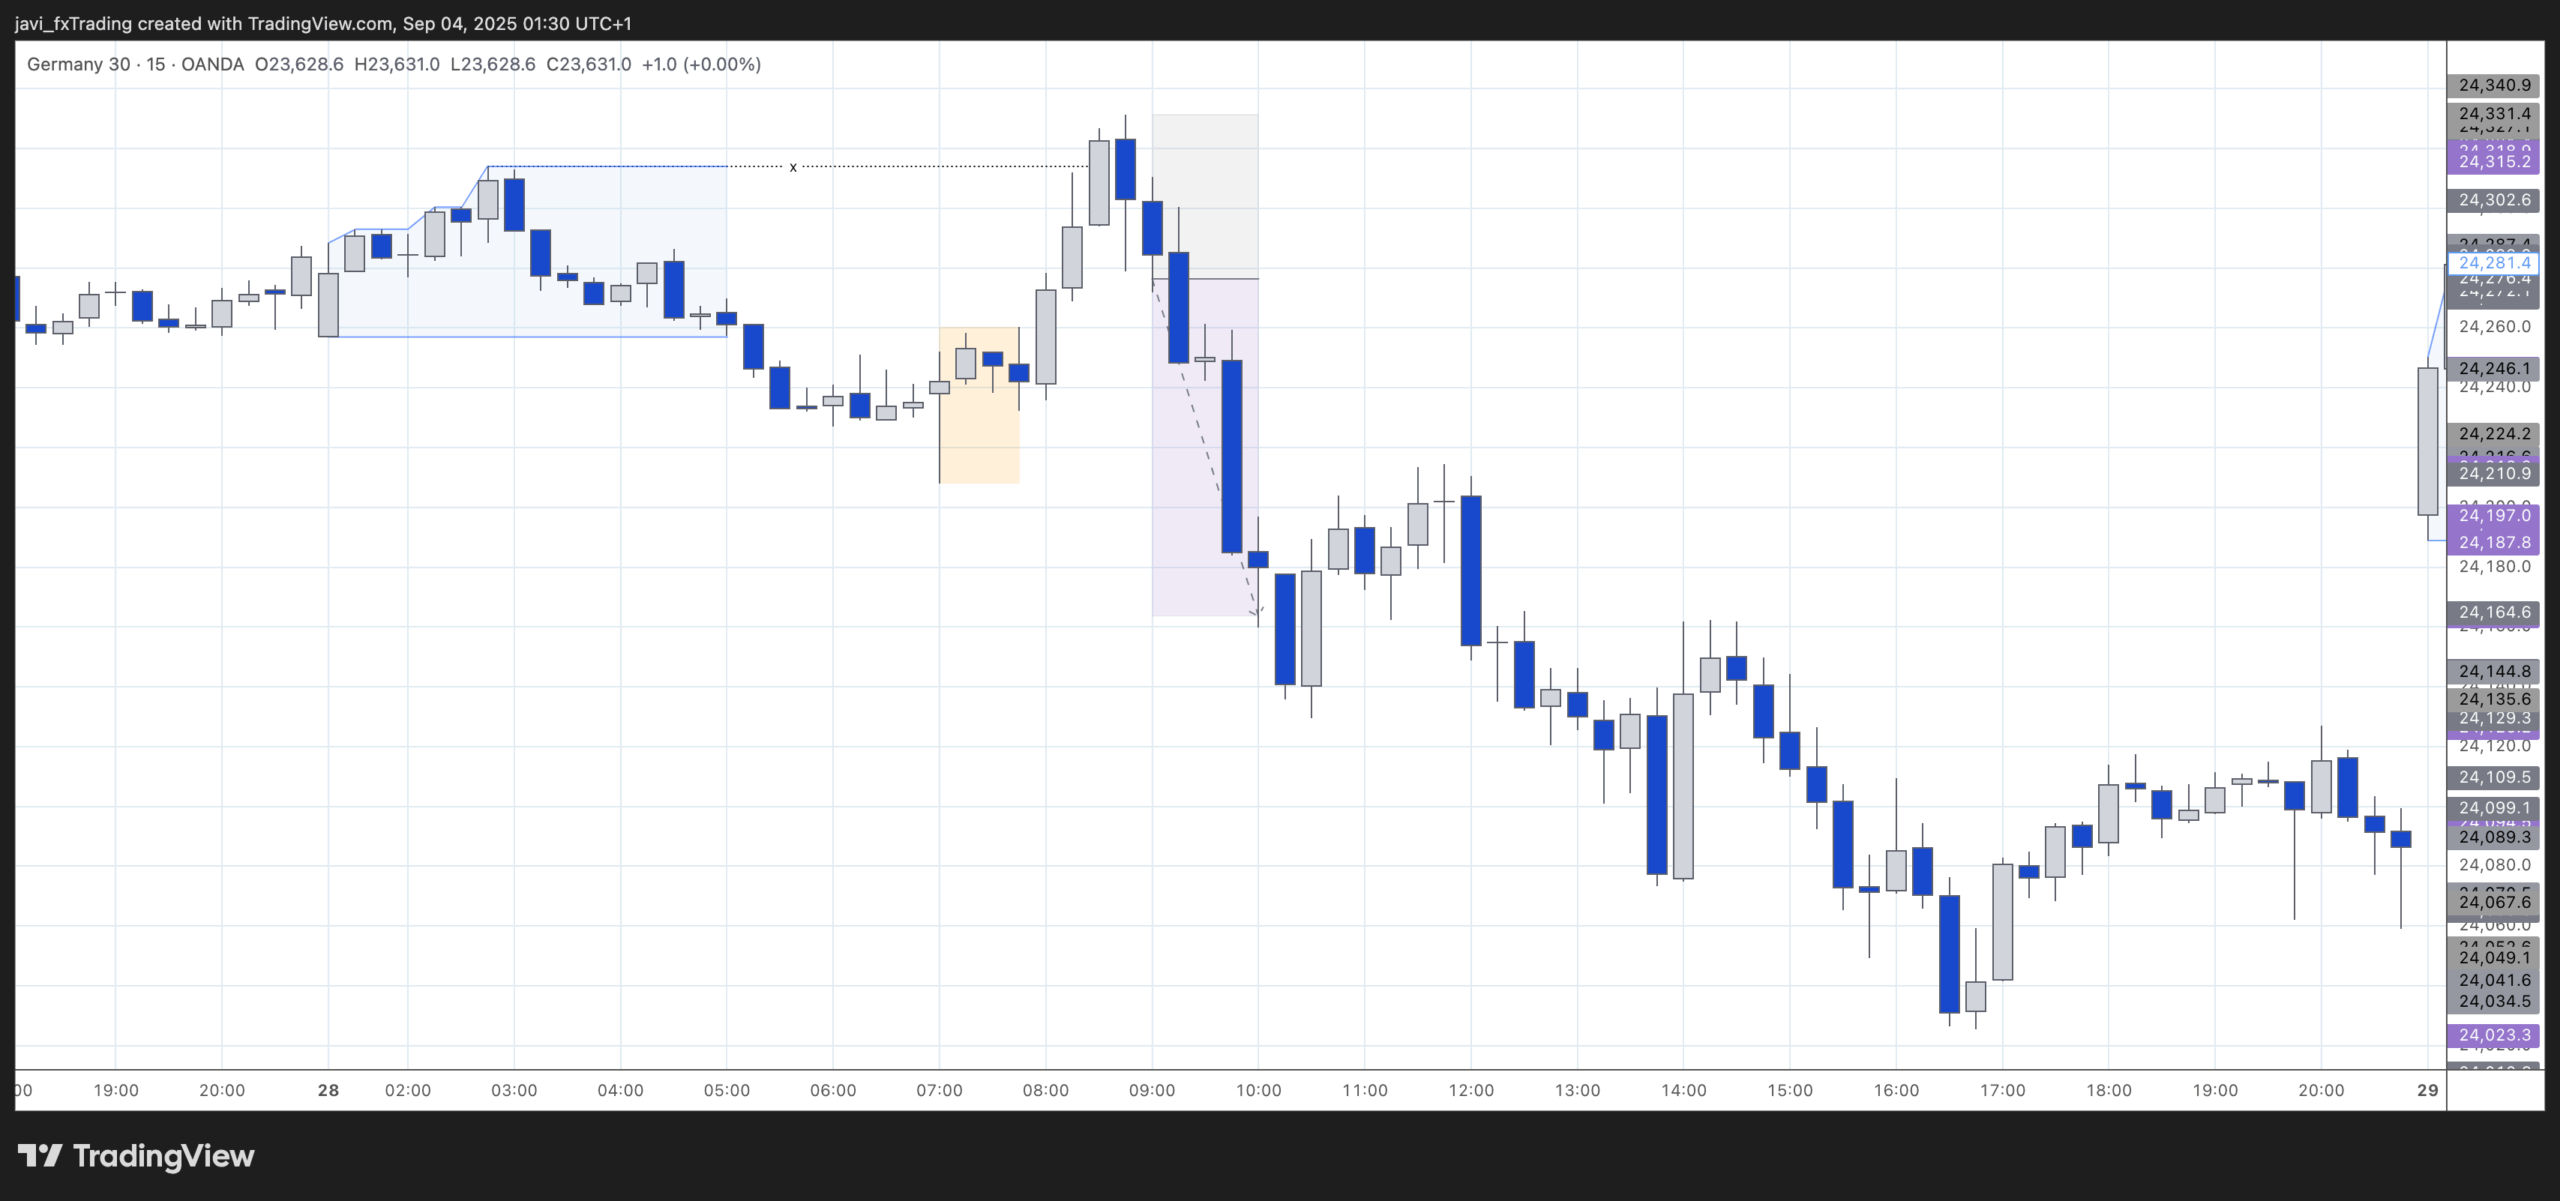
Another Asia liquidity being taken. This time, the market rallies during the London open and sweeps the Asia session’s buy-side liquidity. Immediately after the liquidity grab, a strong bearish candle forms—this becomes our signal bar. The short entry is taken on the break of this candle’s low, and the take-profit target is reached in just over an hour for a 2R. Compared with the previous case, there are two key differences:
- In the earlier example, the signal bar was a doji, whereas here it is a clear bearish candle.
- This bearish candle not only rejects the liquidity grab but also takes out the low of the prior candle, providing a stronger confirmation for the short setup. The stop loss is never threatened in this trade.
One possible refinement is to require the signal bar to be a decisive, directional candle (bullish for longs, bearish for shorts), rather than a doji. In this method, the stop loss would be placed at the high (for shorts) or low (for longs) of the signal bar itself, instead of the high/low created by the liquidity grab candle. This could potentially filter out weaker setups and improve risk management
4th of June 2025 – Invalid setup
Above is a scenario where nothing significant is happening according to our strategy. There aren’t even clear liquidity pools, and the low of the Asia range is not very convincing. After the Asia session, price pushes up during the Frankfurt open and continues rising through the London open. Almost three hours into the London session, price finally turns and begins to fall with some strength, but nothing qualifies for our strategy at that point. There is no nearby level indicating a liquidity sweep, and by then, and by then it is already too deep into the session for it to be considered an opening move.
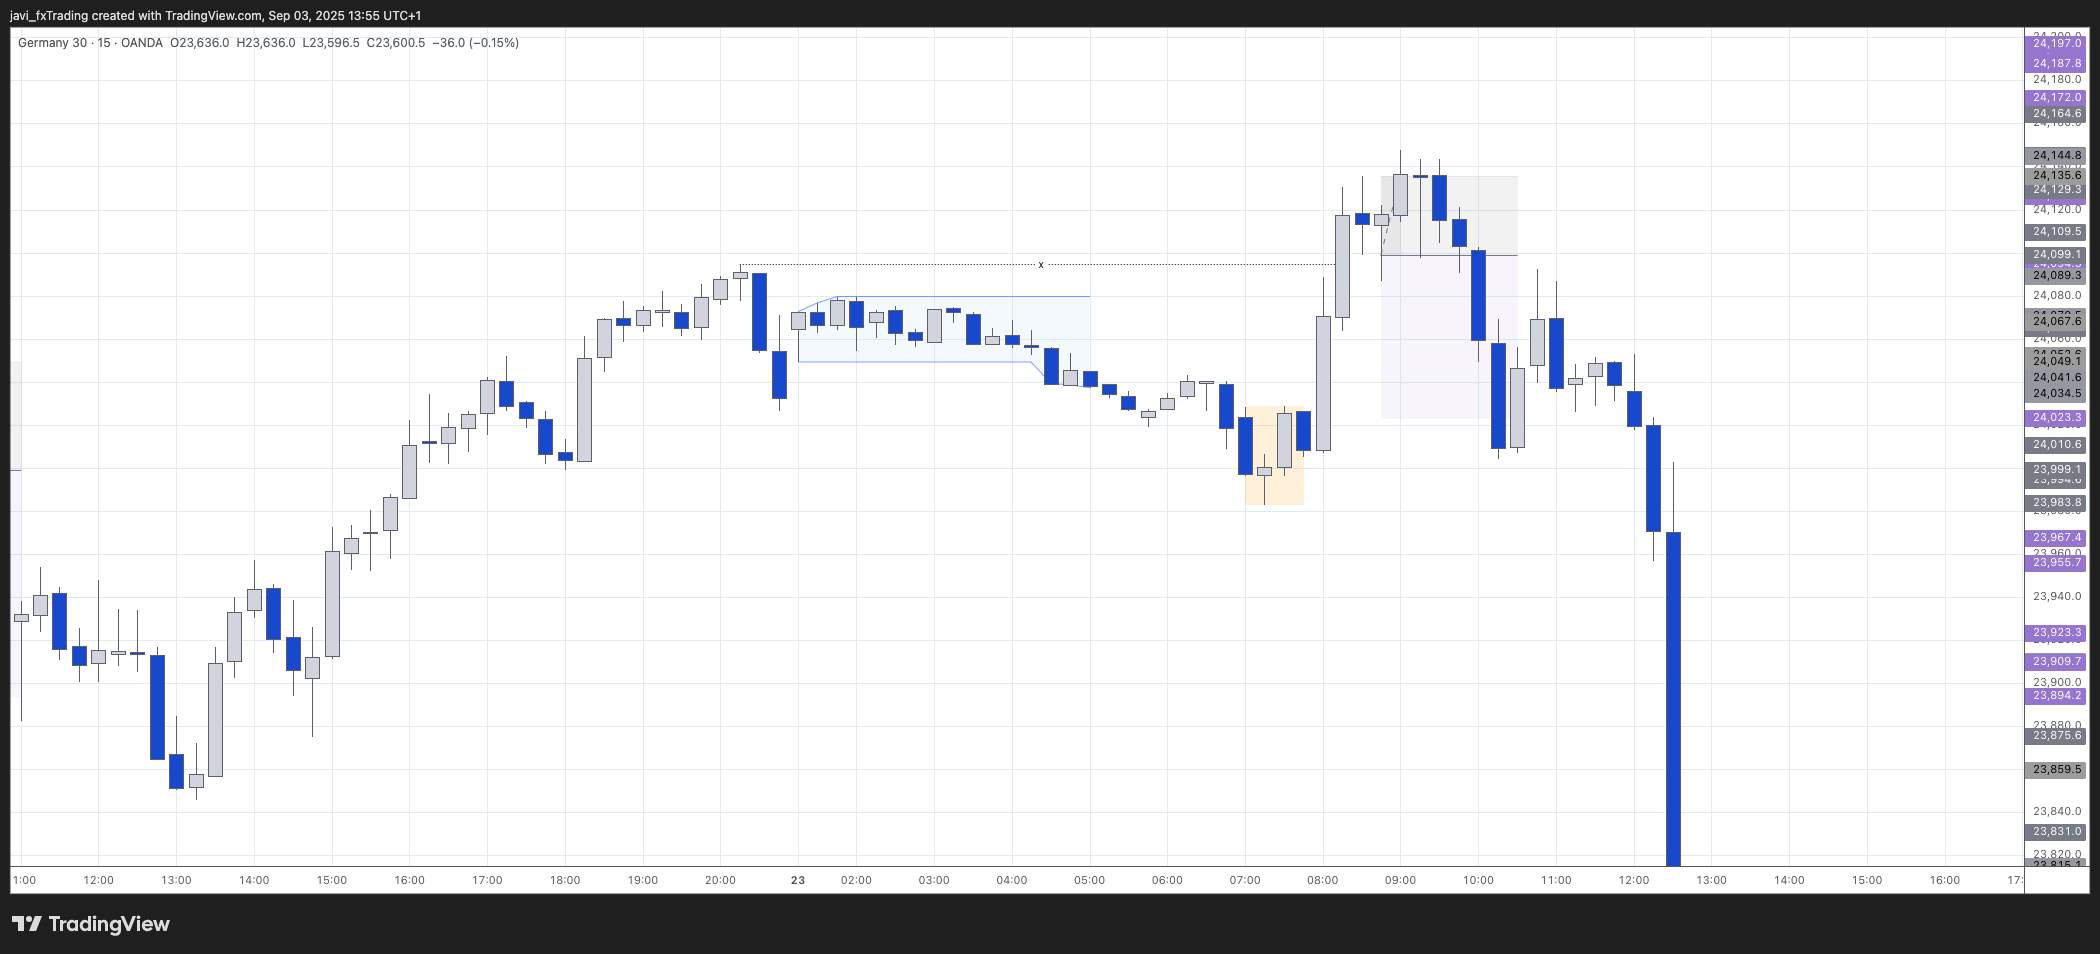
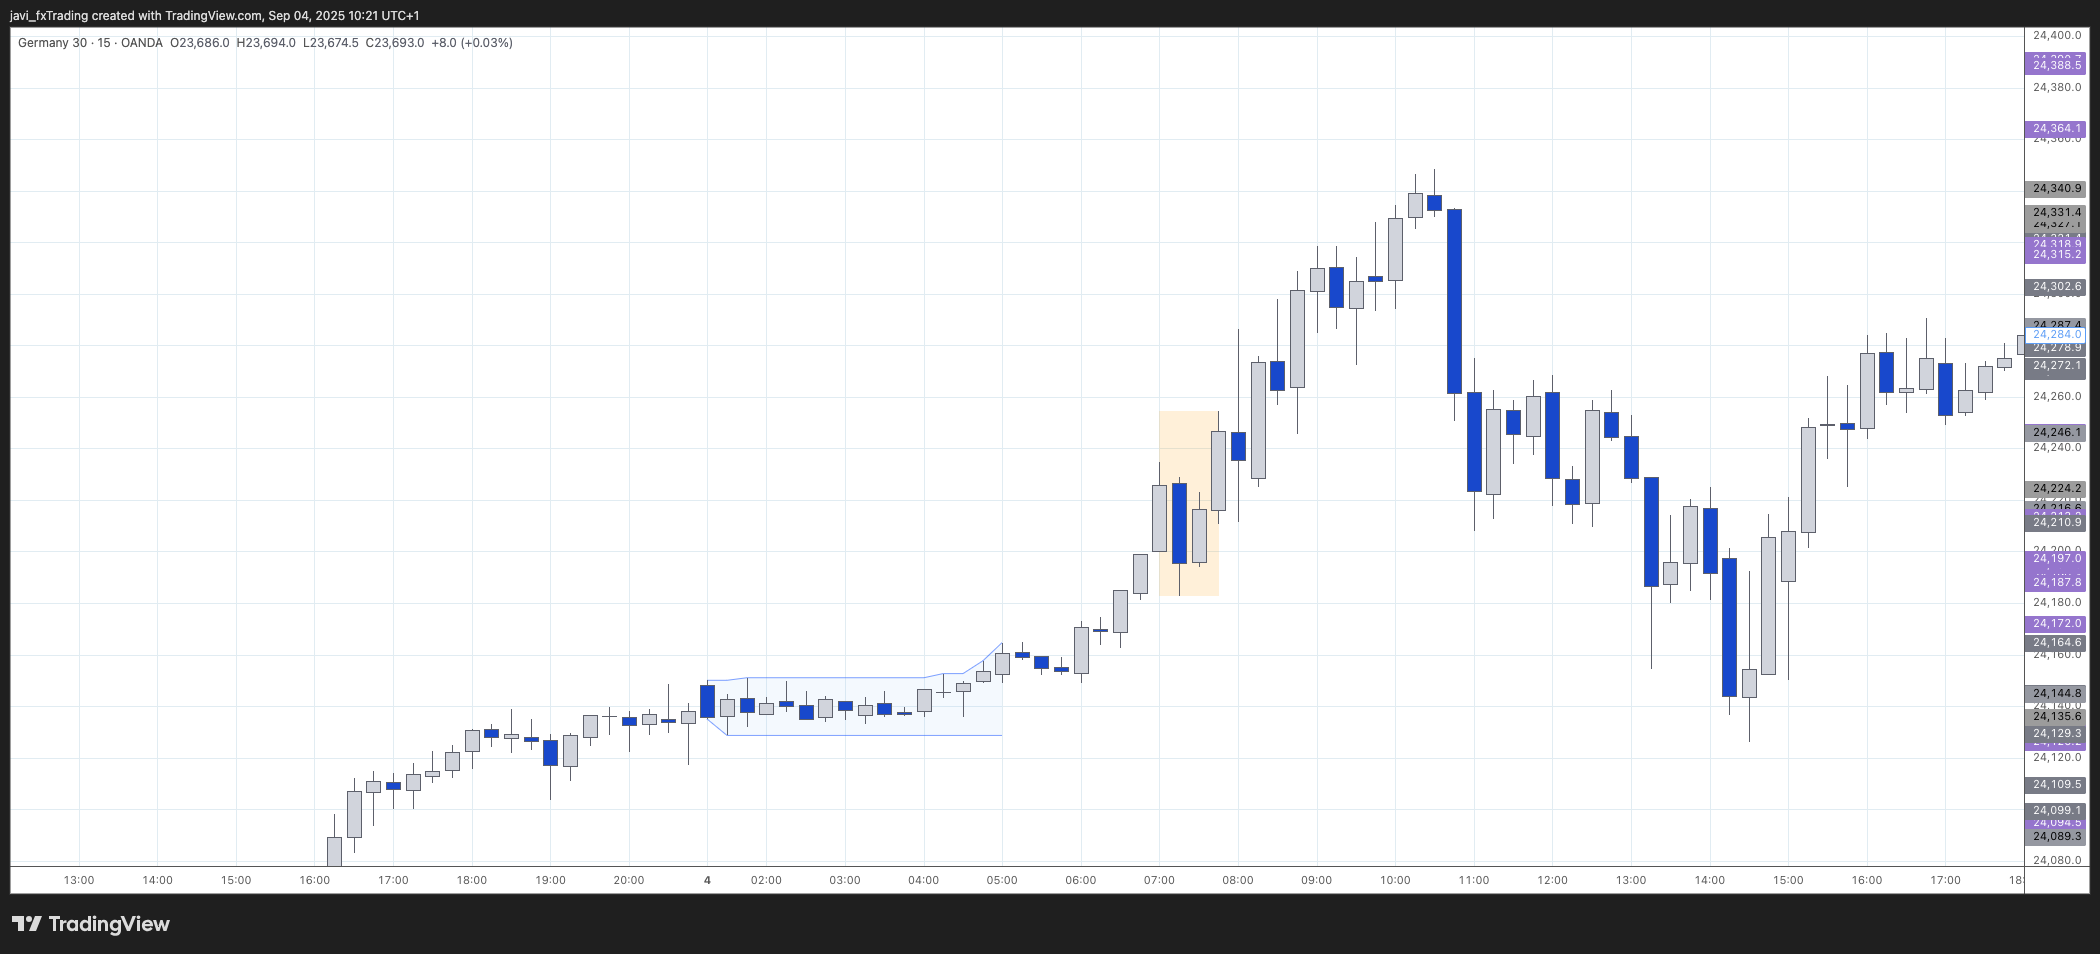
23rd of June 2025 – Win
This example shows a case where some discretion may be required. During the first hour of the Frankfurt session, the Asia high is tapped and—strictly speaking—breached, just as it had been by a few candles before the session began. Afterward, the market reverses and rallies strongly during the first hour of London, eventually sweeping a minor local high before momentum slows down.
By this point, we are already approaching the 2-hour mark. Personally, I prefer setups to appear within the very first hours, when volatility is highest and the initial market manipulation is most likely to occur. At this stage, a doji prints, which is still bullish and therefore not a valid signal. The first bearish candle finally forms at 9:30, and that becomes our trigger: we enter short on the break of its low, with the stop loss placed above the doji.
Why discretion is needed here:
- The Asia high was taken, but without the typical signs of a liquidity sweep.
- The next liquidity grab occurred at a small local high within a minor downtrend, rather than a major session high/low.
- While the setup technically fits the rules, the context and timing make it a borderline case.
For these reasons, this trade falls on the edge of what I’d normally consider part of the strategy.
Conclusion
The strategy shows solid results, with close to 50R over a 6-month period. There were no negative months, with the weakest being June (+1.5R) and the strongest August (+10.25R, up to the 20th). Of course, these are backtested results; the same performance cannot be guaranteed in live market conditions where execution speed, psychology, and real risk-taking come into play.
Pros:
- Low screen time: I only need to monitor the charts for about 1.5–2 hours around the London open. Since the strategy uses 15-minute candles, I don’t need to be hyper-focused and can even set alerts at key liquidity levels.
- No missed trades: As long as I’m present during the London open, I won’t miss opportunities. This differs from strategies where signals can trigger at any time of day.
- Good trade frequency: With ~8 entries per month (around one every other day), the strategy provides enough setups to validate performance and generate meaningful returns without relying on just a few trades.
- Decent risk/reward: The R:R profile is attractive, making drawdowns easier to recover from and compounding more effective.
Cons:
- Discretionary elements in liquidity sweeps:
- Not all Asia highs/lows carry the same weight.
- The relevance of the liquidity taken from other high and lows may vary depending on the surrounding market structure.
- Qualifying price action can vary: ideally, a liquidity grab leaves a long wick, but a bullish candle followed by a bearish one (or vice versa) may still qualify when viewed on higher timeframes.
- Early London volatility: The first hour can be choppy, and stop-losses sometimes get triggered before the move develops in the intended direction.

