4H Chart
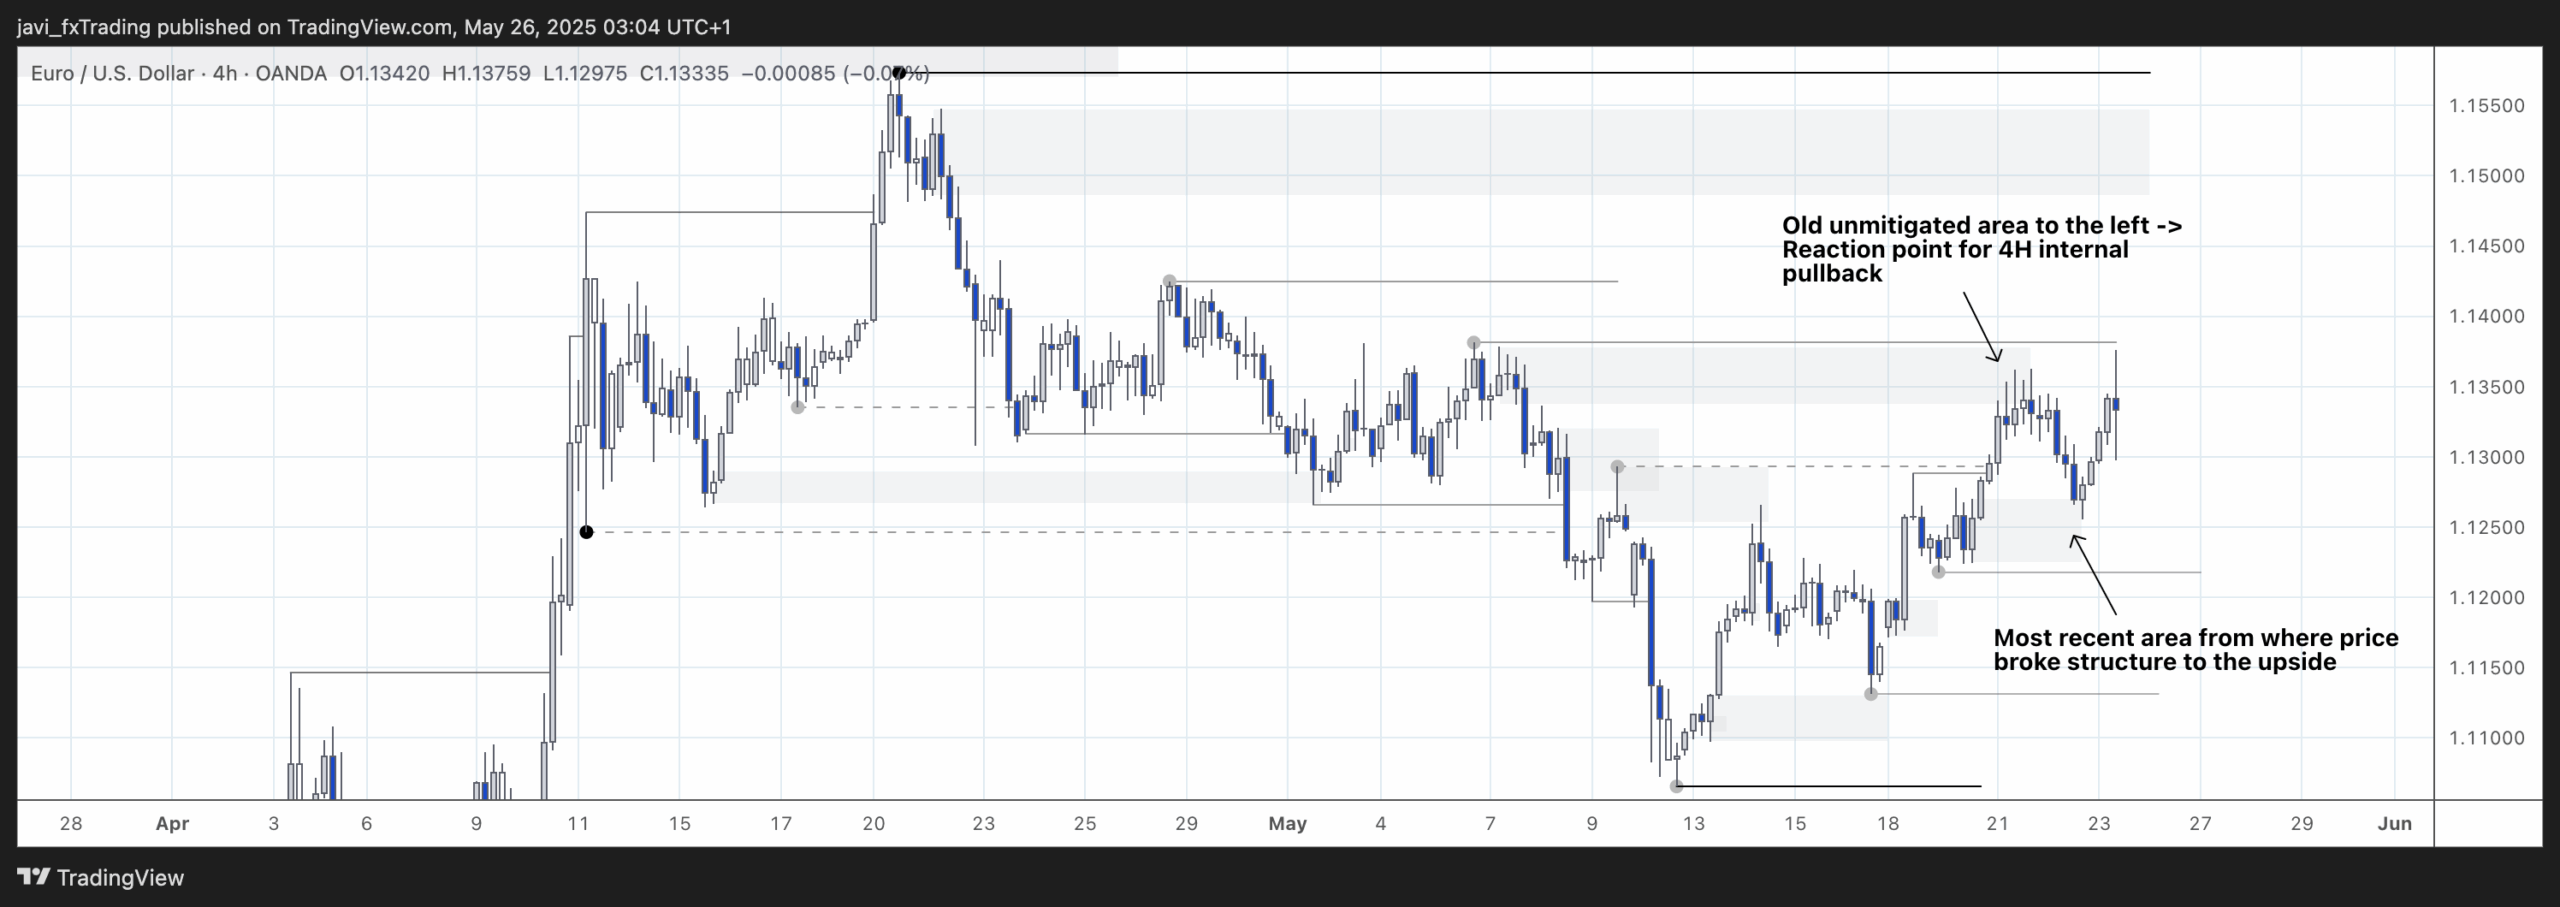
4H swing is bearish. Internal is bullish.
In the most recent price action, price mitigated a 4H demand zone and continued its internal bullish structure, pushing deeper into the premium zone of the current 4H swing leg. It’s important to keep in mind that we’re still expecting the strong 4H swing high at the top to hold in order for the overall 4H bearish trend to remain intact.
For now, we simply follow the internal bullish structure as it plays out. There’s just one more significant area of interest left before price reaches that major swing high. It’s still a bit of a distance away, but with no major obstacles in the way, price could reach it relatively easily.
That said, this is just an expectation based on current structure — and as always, price is free to do whatever it wants.
15min Chart
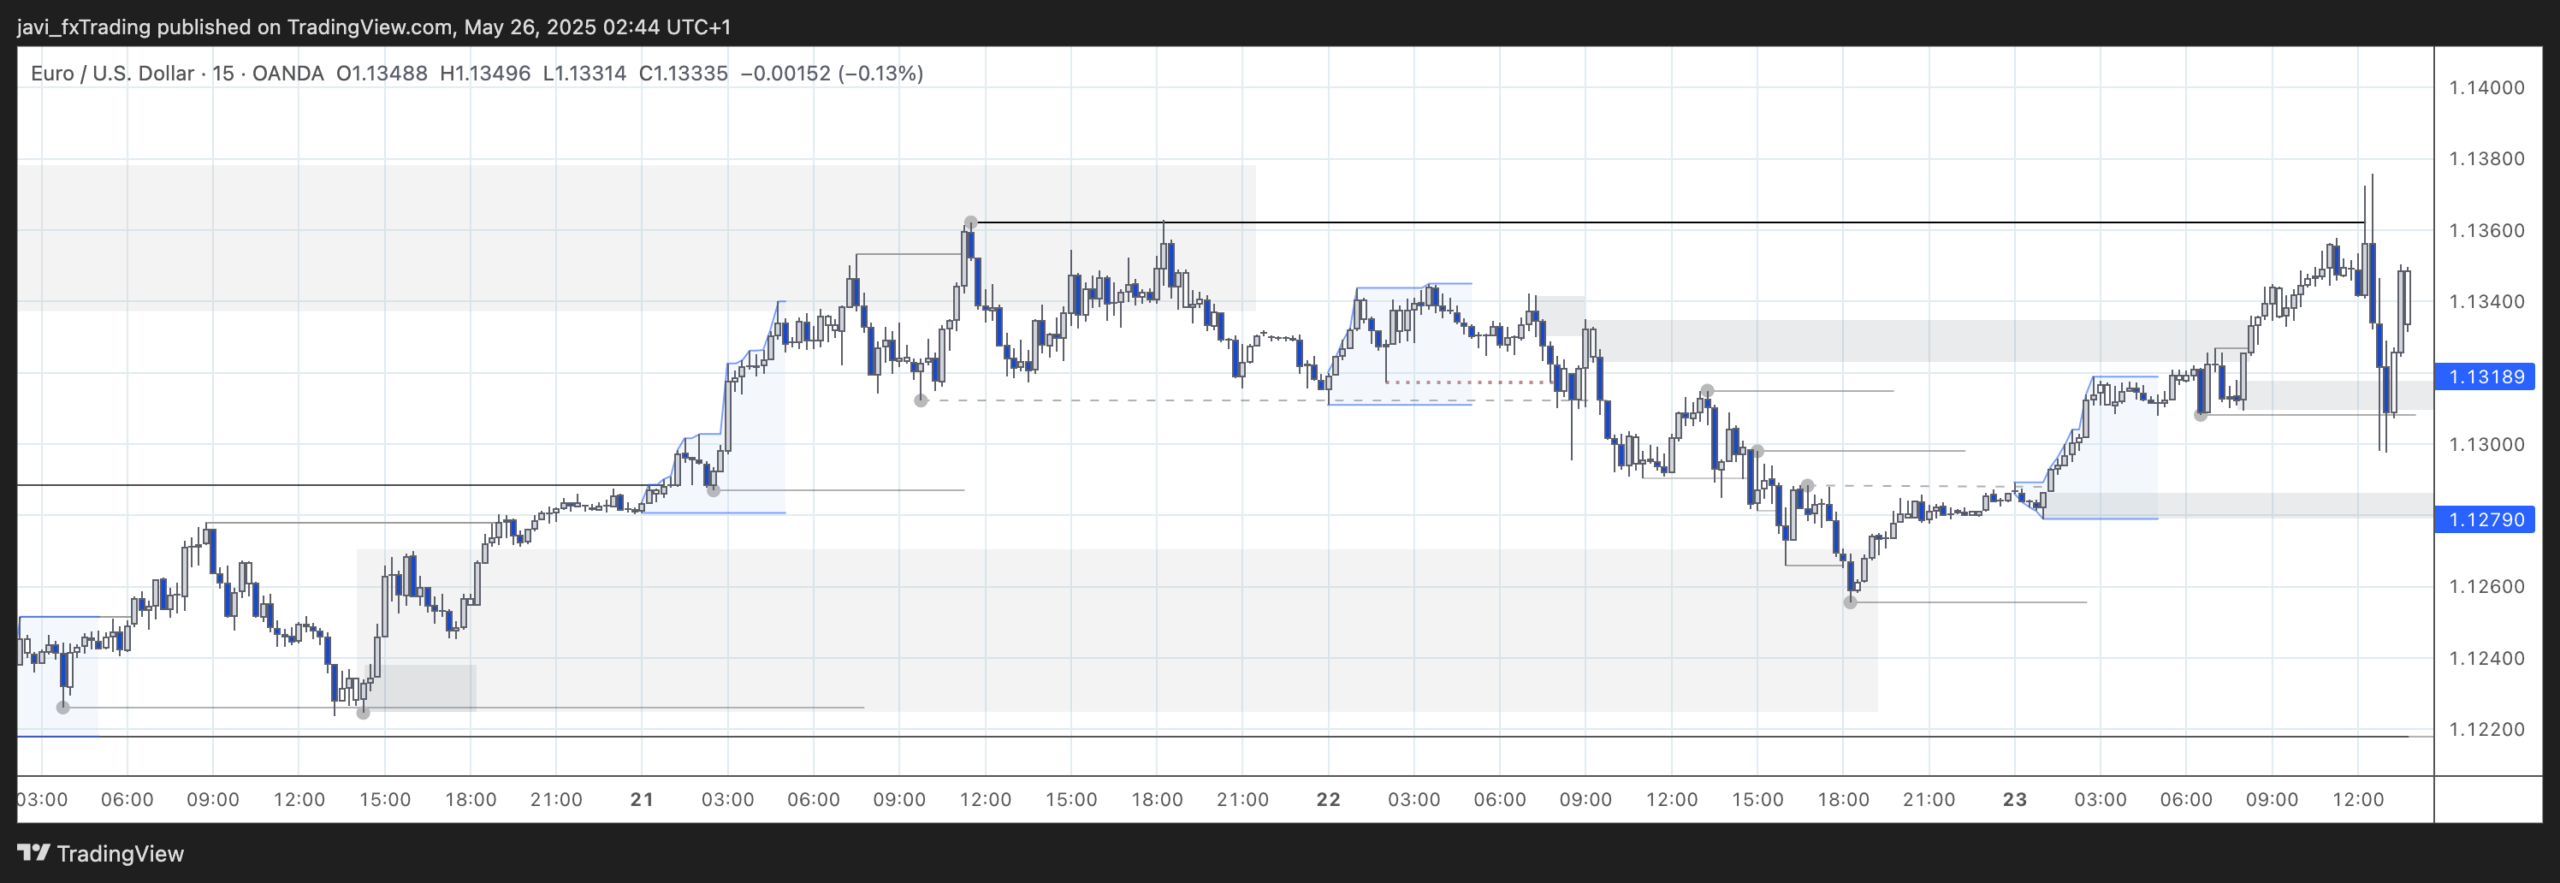
The 15min swing structure is bullish. Internal structure also turned bullish after price tapped into the 4H demand zone during the New York session and later broke the internal structure high during early Asia.
From there, price began moving upward, continuing the bullish 15min trend.
Session Outlook and Entries
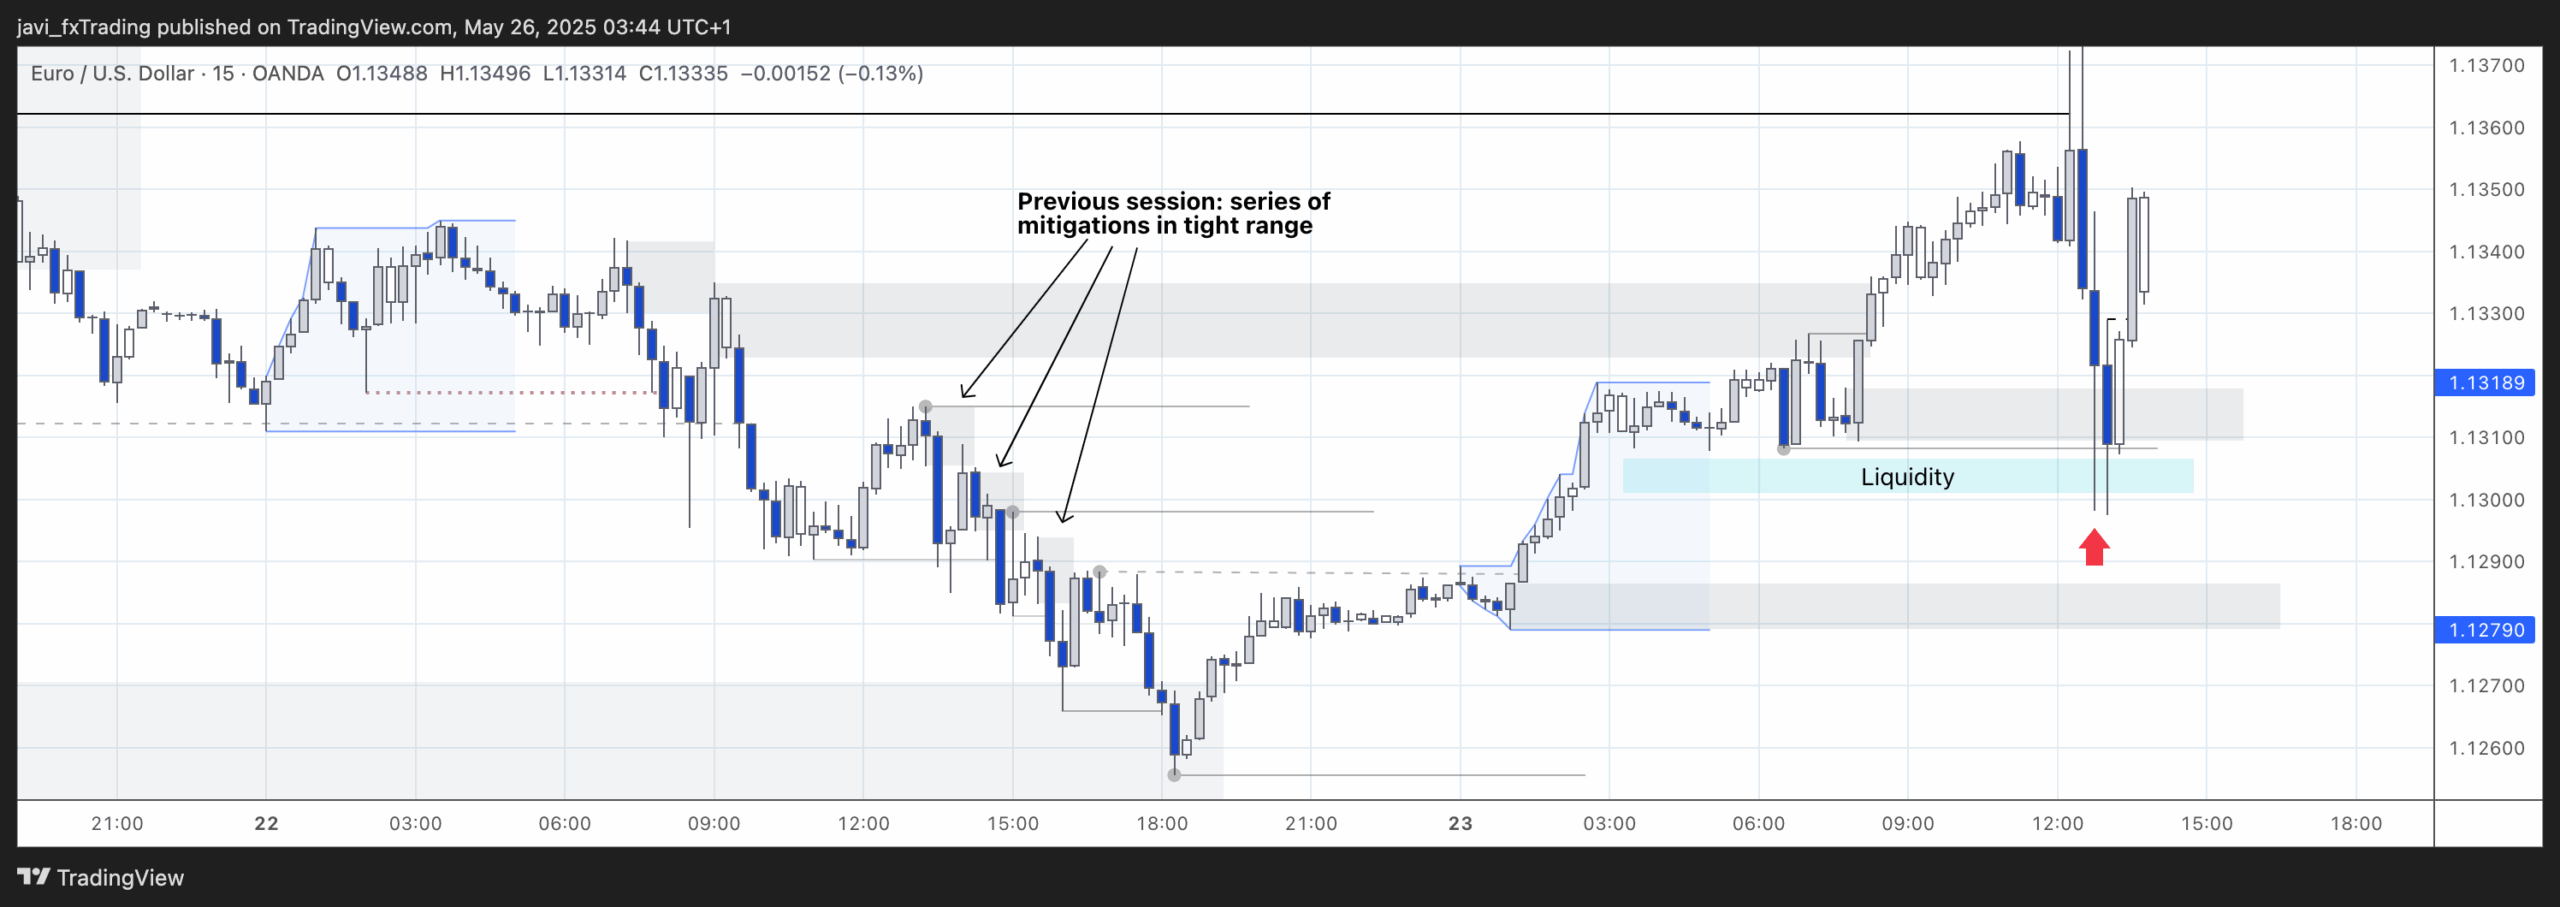
Before diving into the main session analysis, I want to highlight a few potential entries from the previous session that I didn’t mark originally, as I typically focus on price action between 7:00 AM and 1:00 PM London time.
Starting from around 1:00 PM, a sequence of small mitigations within narrow ranges appeared, presenting some trading opportunities. Given the nearby 4H demand zone below — first touched with a wick around 16:00, and then more deeply tested at 18:15 — the first mitigation stands out as the most favorable. It offered a solid 3R setup, thanks to a tighter stop-loss that could be placed above the structure. The second entry still delivered a decent 2R, though it became increasingly risky as price approached a higher timeframe Point of Interest (PoI).
As for the current session, it was a tricky one. Price moved upward during the Asian session, but the movement was corrective, lacking any strong bullish candles. A previous PoI to the left offered little in terms of pullback, and price pushed through it with relative ease. While that break did create a fresh PoI, the resulting trade unfortunately ended in a loss. There wasn’t anything fundamentally wrong with the setup — it was structurally valid — but the presence of equal lows likely indicated a pool of liquidity, which was swept just before price reversed and moved higher — this time with clearer bullish momentum.
Final Thoughts
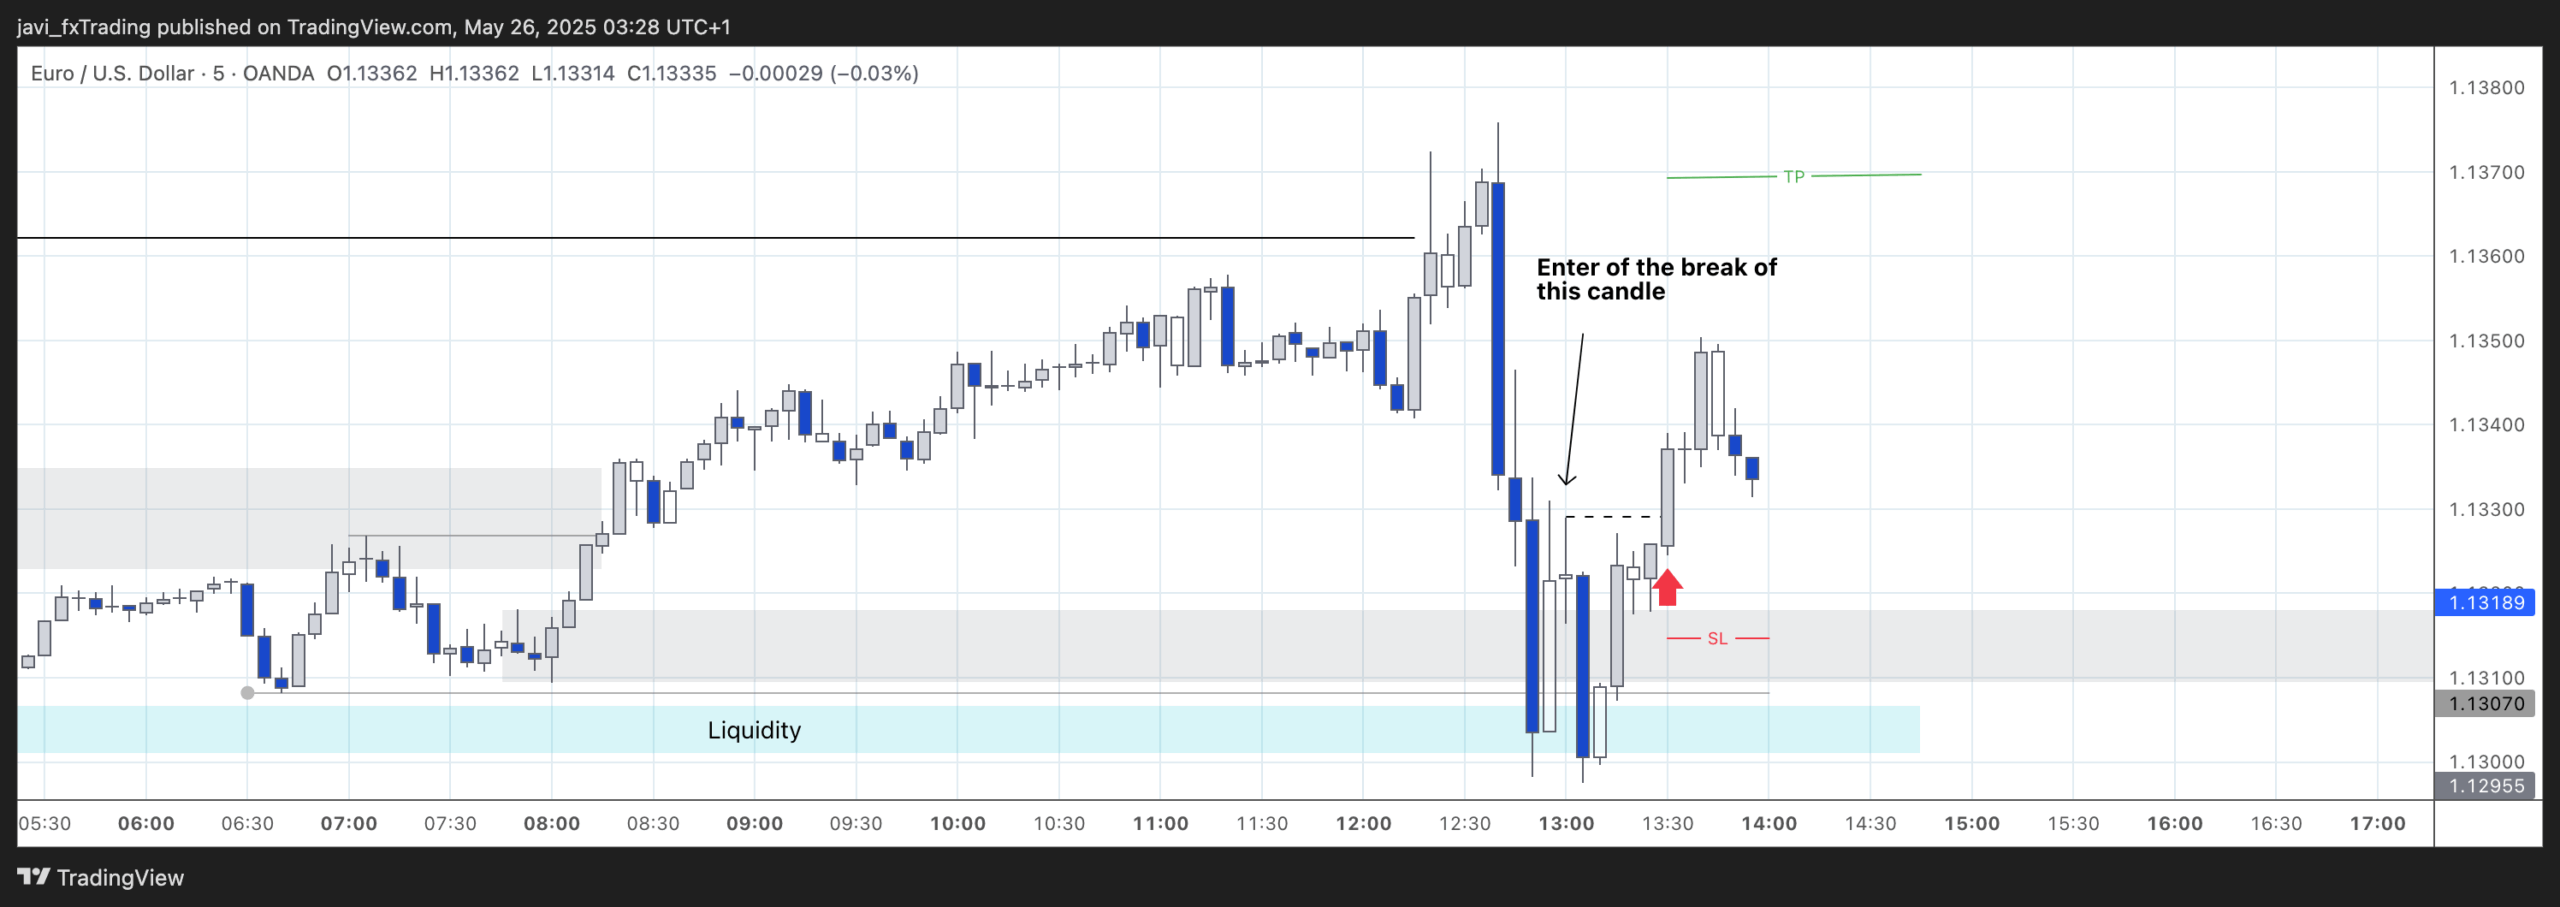
- In situations where a liquidity grab appears likely, instead of using a limit order, we can consider placing a stop order on a lower timeframe (e.g., 5-minute) once price begins to shift upward again. Ideally, wait for a small break of structure followed by a brief pause or consolidation, which helps define a tighter stop-loss area.
- It’s important that price does not close below the PoI — only wicks below it — on the 15-minute chart, as shown in the example above. This subtle detail helps confirm the validity of the level.
- That said, this approach still needs further testing to validate its consistency and effectiveness.