
4H Chart
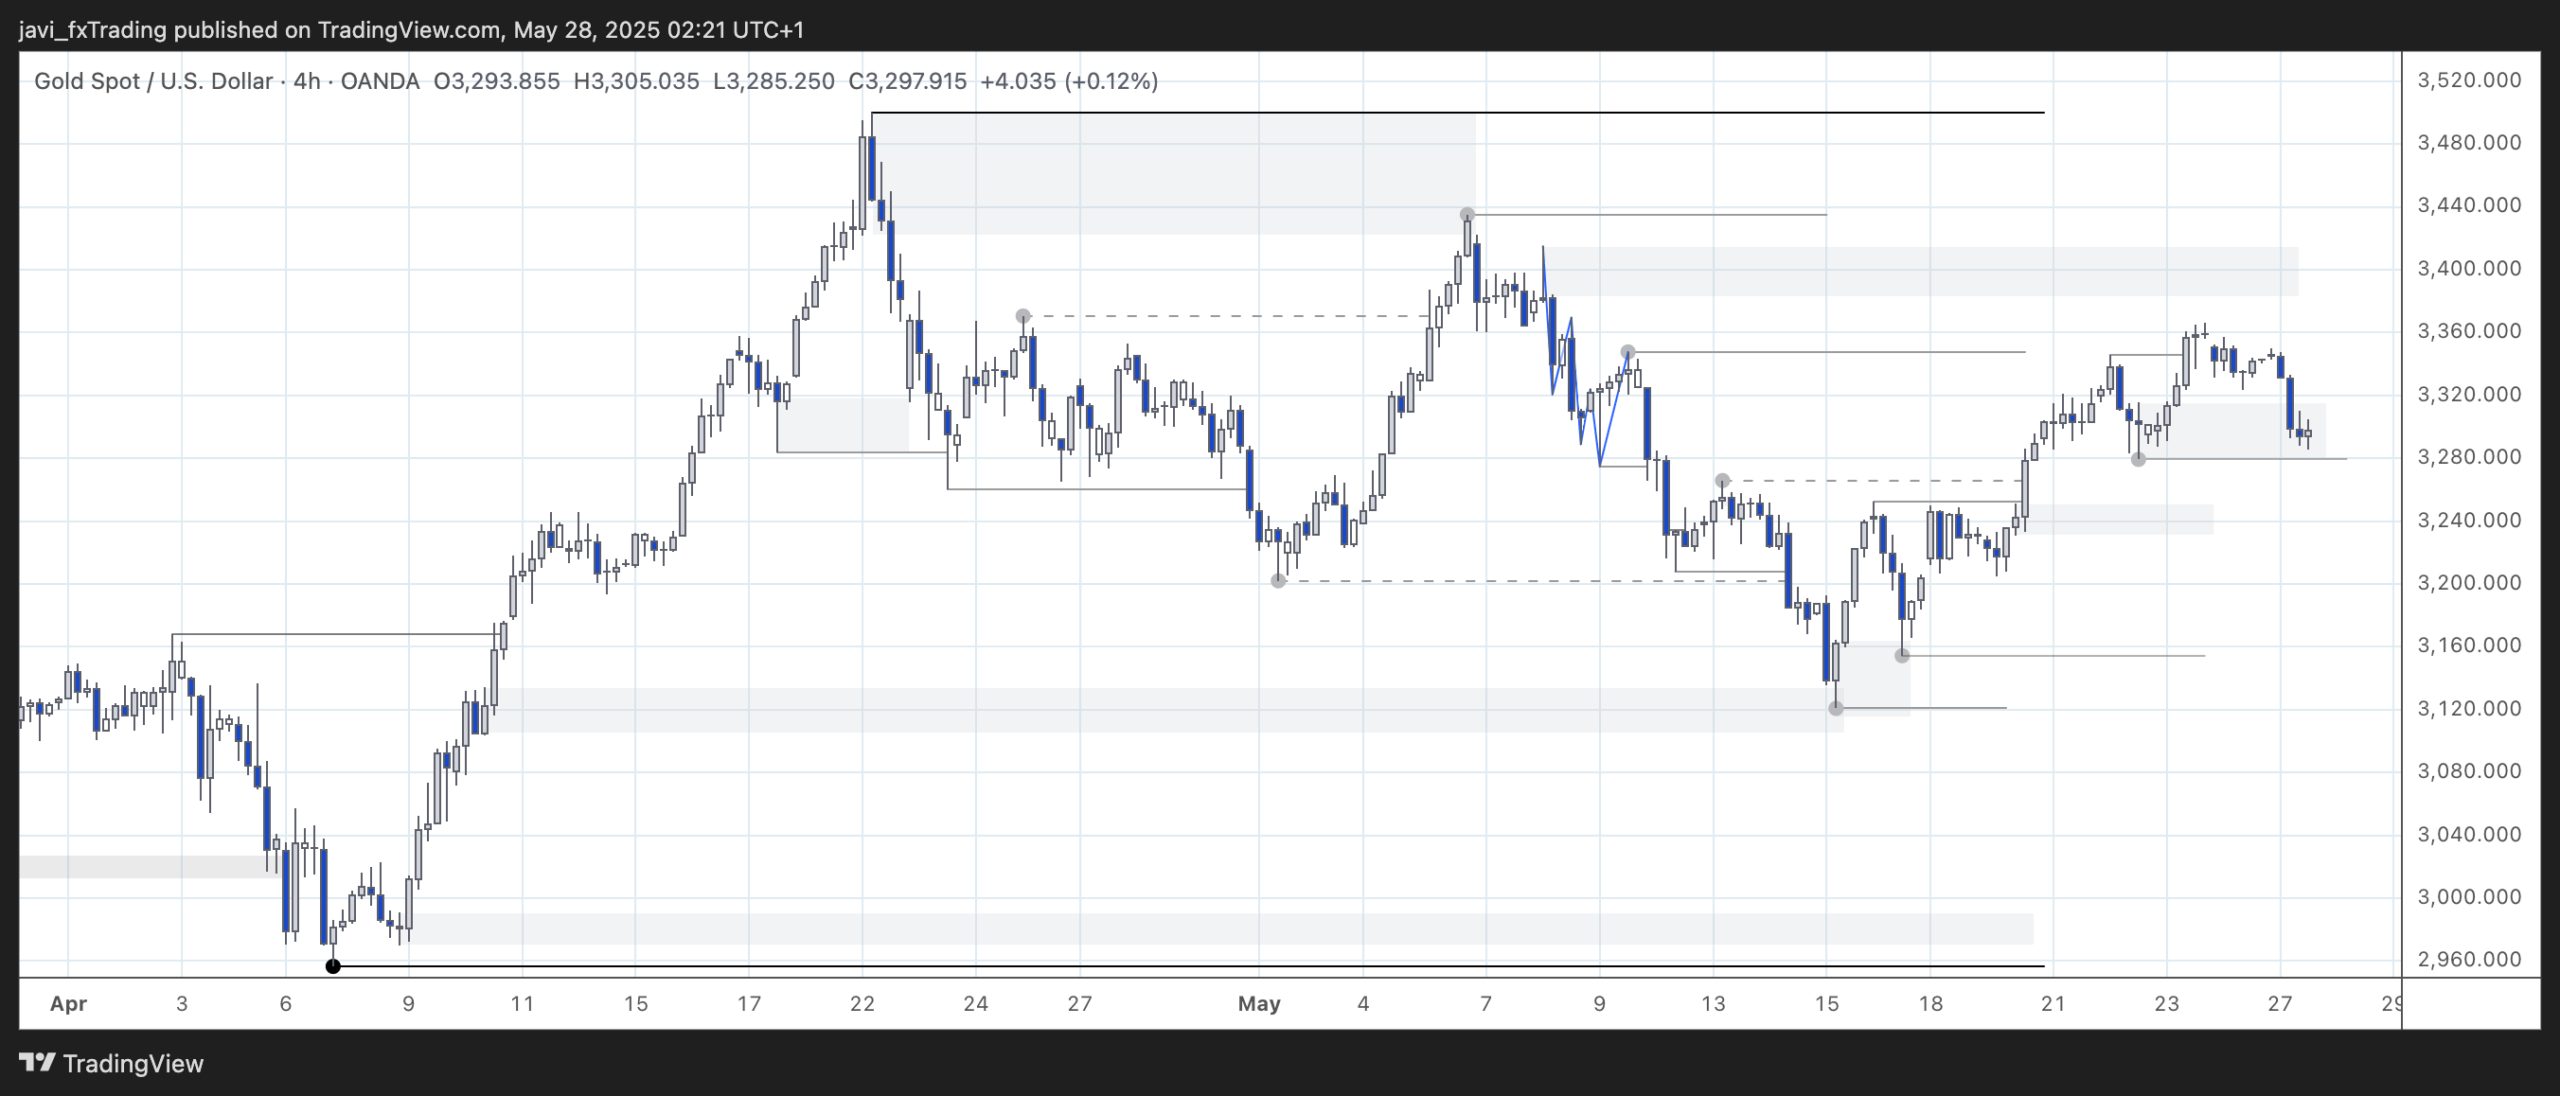
4H swing is bullish. Internal is bullish too.
Price has now reached the strong internal low. For the 4H internal bullish trend to remain valid, this level needs to hold. If it does, the internal structure will stay aligned with the overall 4H swing bullish structure, offering potential continuation to the upside.
Just a quick thought on structure mapping. Some of you might be viewing the swing structure as bearish if you’re mapping it more tightly, identifying the last two strong highs as the all-time high and the one just below 3,440. In that case, a break of the current internal low would simply bring the internal structure in line with that bearish swing view.
There’s nothing wrong with that interpretation. It’s important to recognize that, due to the market’s fractal nature, different trends can coexist across different timeframes. However, higher timeframes tend to carry more weight. On the daily chart, structure still appears clearly bullish, which suggests that even if we consider the 4H swing structure bearish (based on tighter mapping), it might be nearing its end. Price has reached the discount zone of the last daily bullish leg, which could indicate a potential shift back to the upside.

15min Chart
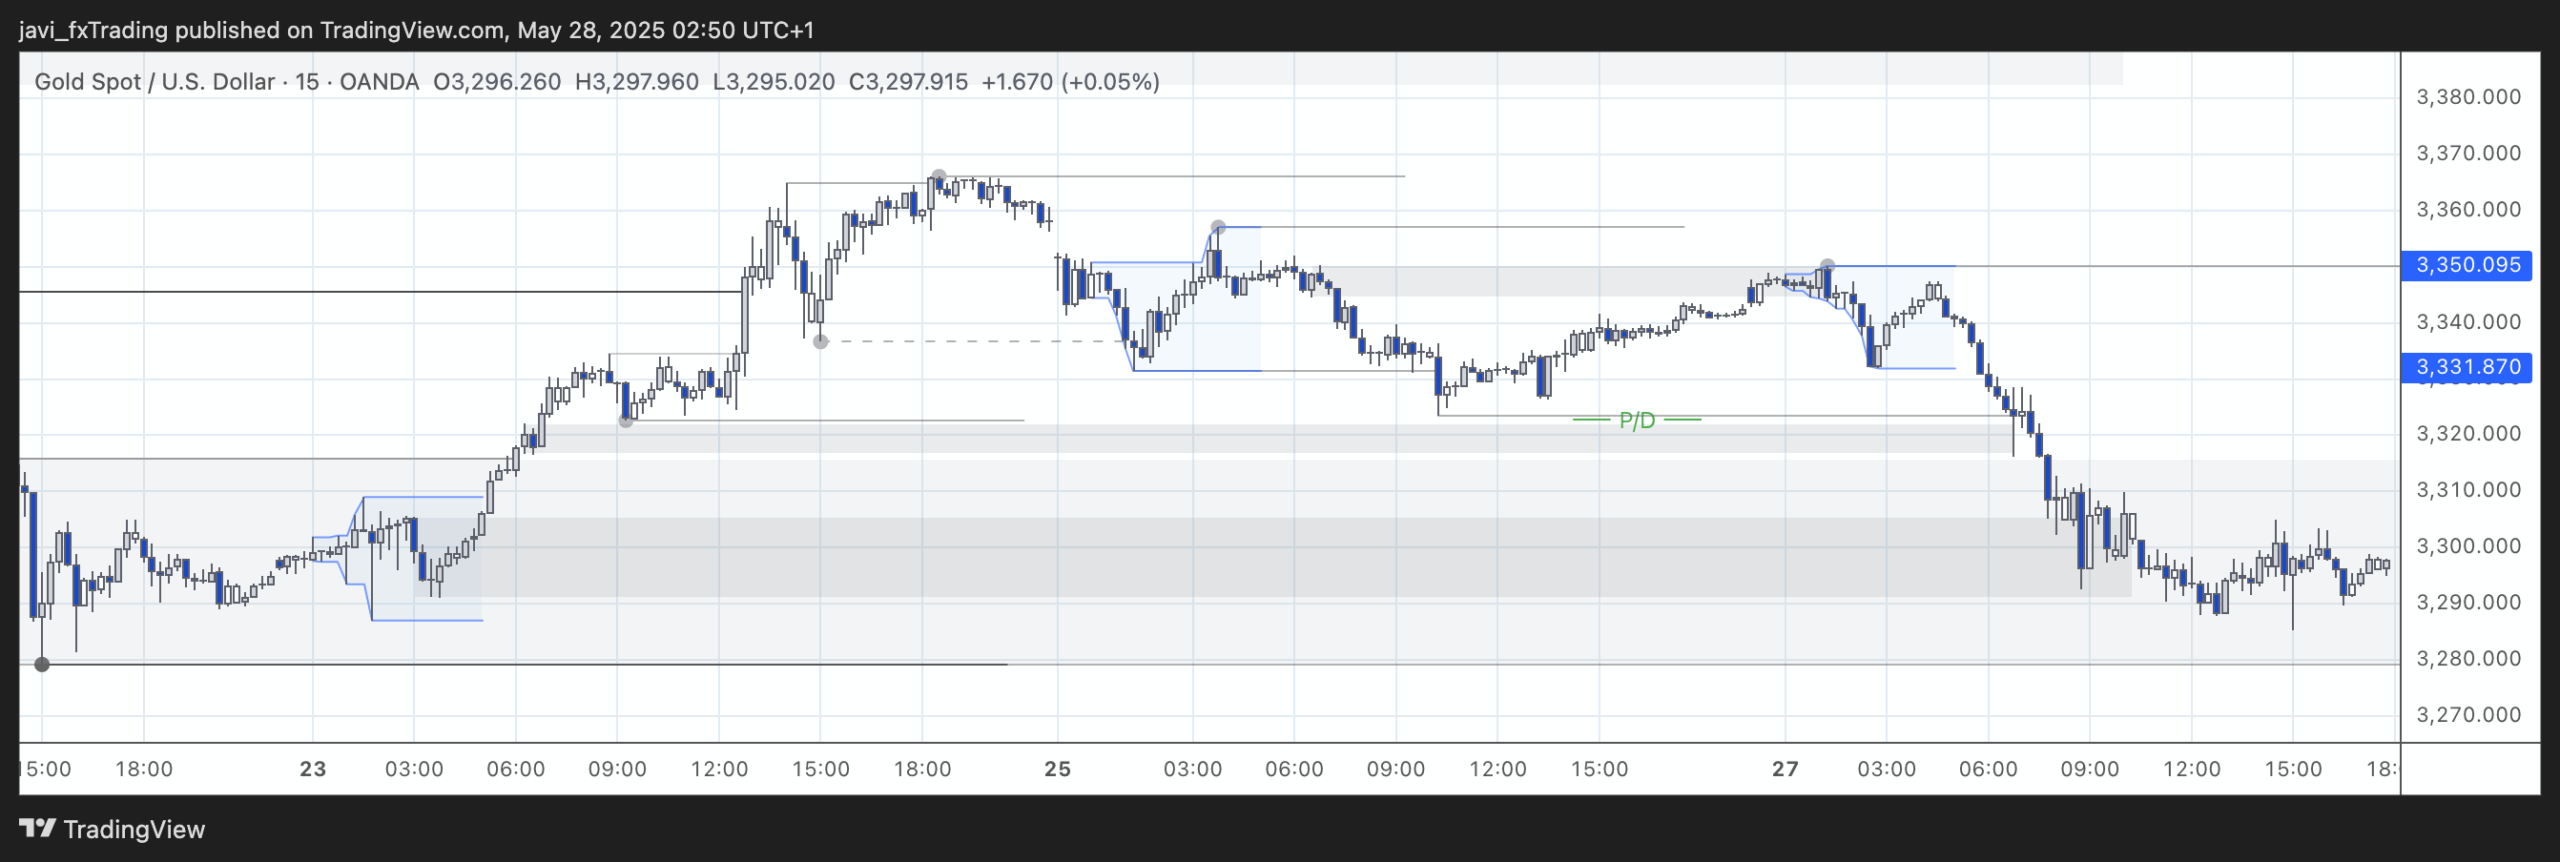
15m swing is bullish. Internal is bearish.
Price reached the strong swing low by the end of the session. The Points of Interest (PoIs) along the way down aren’t particularly convincing. The one just below the equilibrium (EQ) is quite narrow — more of a brief pause in price action than a meaningful zone. The broader PoI, where I marked the entire range, lacks strong bullish candles, but as it’s the last area that needs to hold, it has a higher probability of reacting.
Session Outlook and Entries
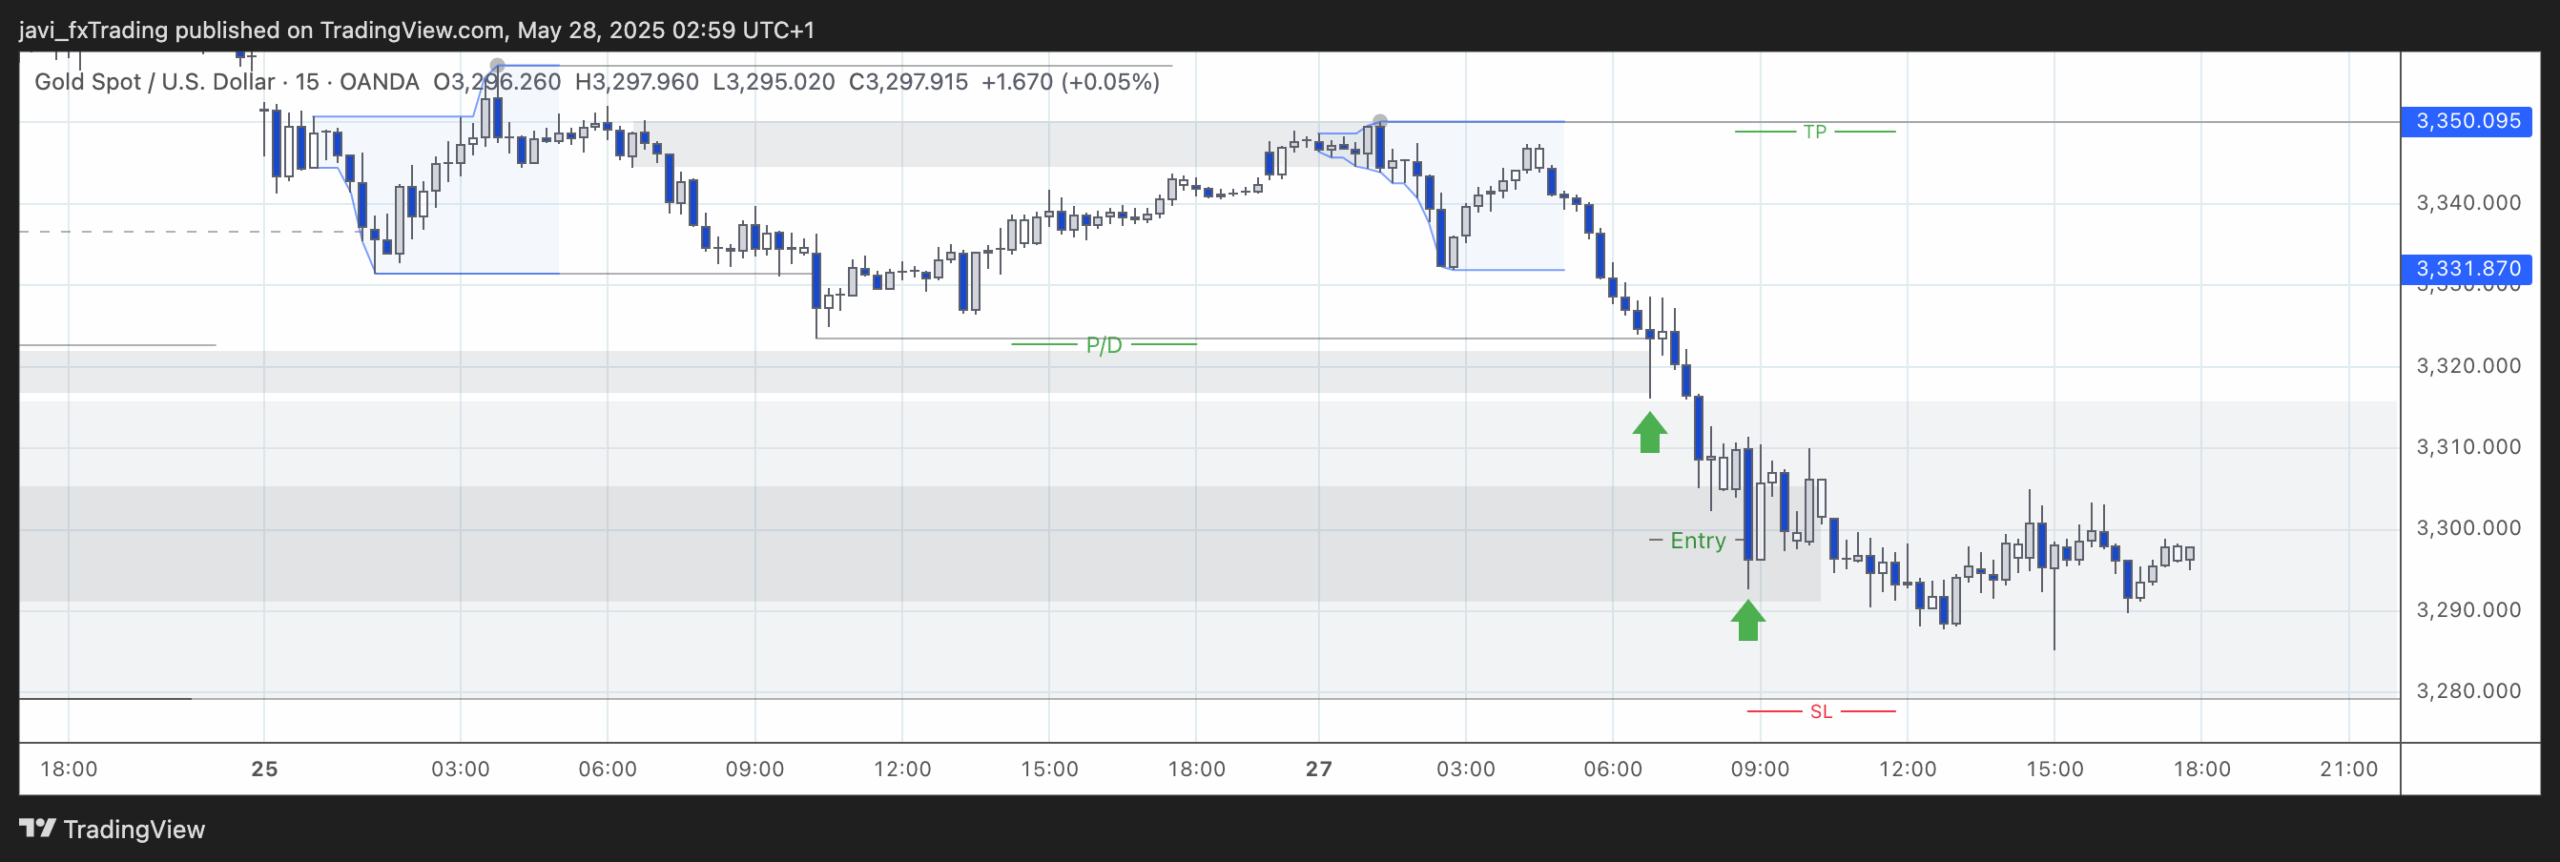
The bias remains bullish at the extreme of the range, as we expect that level to hold. That said, caution is necessary since the internal structure is still bearish. Short setups would be risky here, given the proximity of the strong internal low.
The first potential entry (first green arrow) came too early in the session. That’s actually a good thing — going long from that point would have been too aggressive given the context.
At that time, internal structure was still bearish, and although price had reached the equilibrium (EQ) of the range, only the extremes should be considered for counter-trend entries.
The second setup offered better potential. The area I marked is relatively wide, and it would have been more prudent to cover the internal strong low with a deeper entry — rather than entering right at the edge of the 15-minute PoI. A more balanced approach would be to enter around the 50% or 61.8% retracement of the zone, with the stop-loss just below the strong swing low. The target would be just before the strong internal low (which we expect to break), offering a 2.4R trade.